Fig. 6.
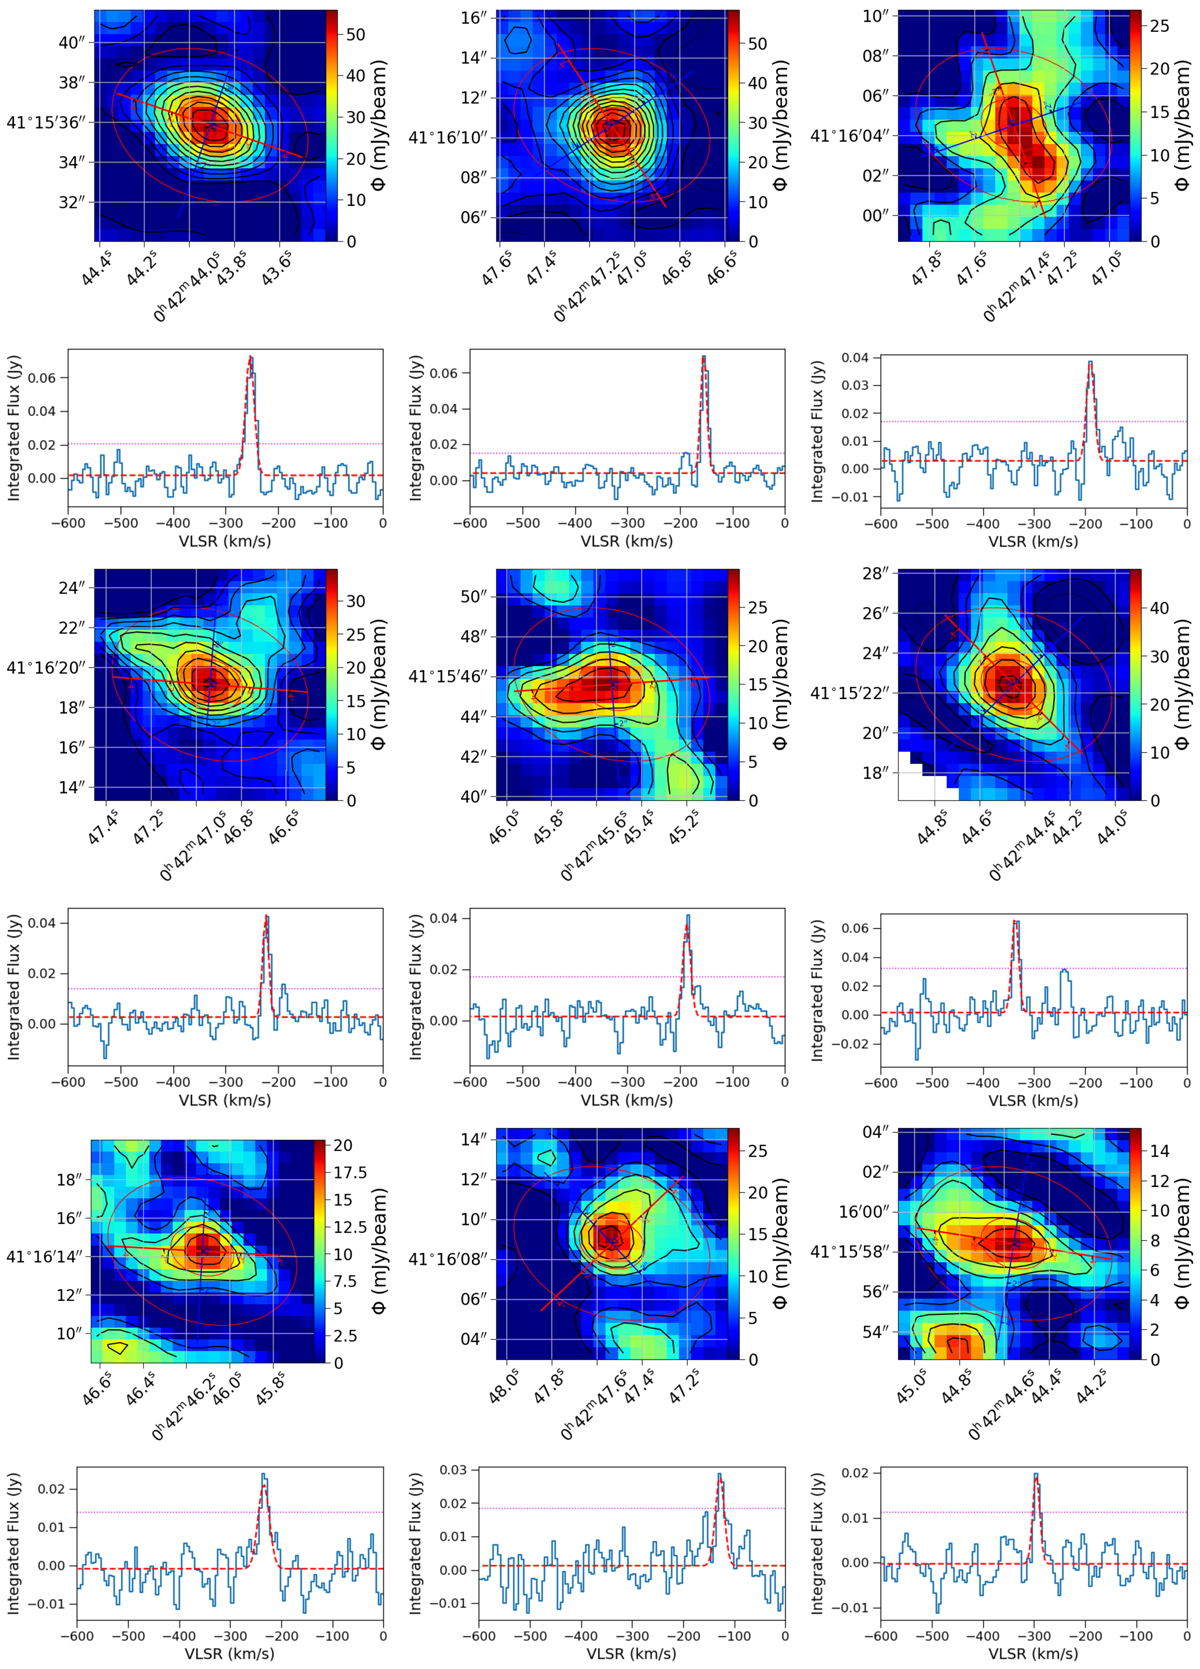
Maps for the 12 clumps centred on the pixel and channel with peak flux and their associated integrated spectrum, organised by order of decreasing SNRtot (i.e. ID1 to ID12). The major and minor axes are shown with a red and blue line, respectively. Two ellipses show the area of the FWHM beam and of the box used for the calculation of extrapolation (with major and minor axis three times as big as the beam). The contours are separated by one sigma each; the negative sigma is shown with dashed contours. The spectra are represented in blue. The magenta dashed line in the spectrum is the 3σ level used for the selection procedure and the dashed red line corresponds to the Gaussian fit performed over the peak emission.
Current usage metrics show cumulative count of Article Views (full-text article views including HTML views, PDF and ePub downloads, according to the available data) and Abstracts Views on Vision4Press platform.
Data correspond to usage on the plateform after 2015. The current usage metrics is available 48-96 hours after online publication and is updated daily on week days.
Initial download of the metrics may take a while.