Fig. 4.
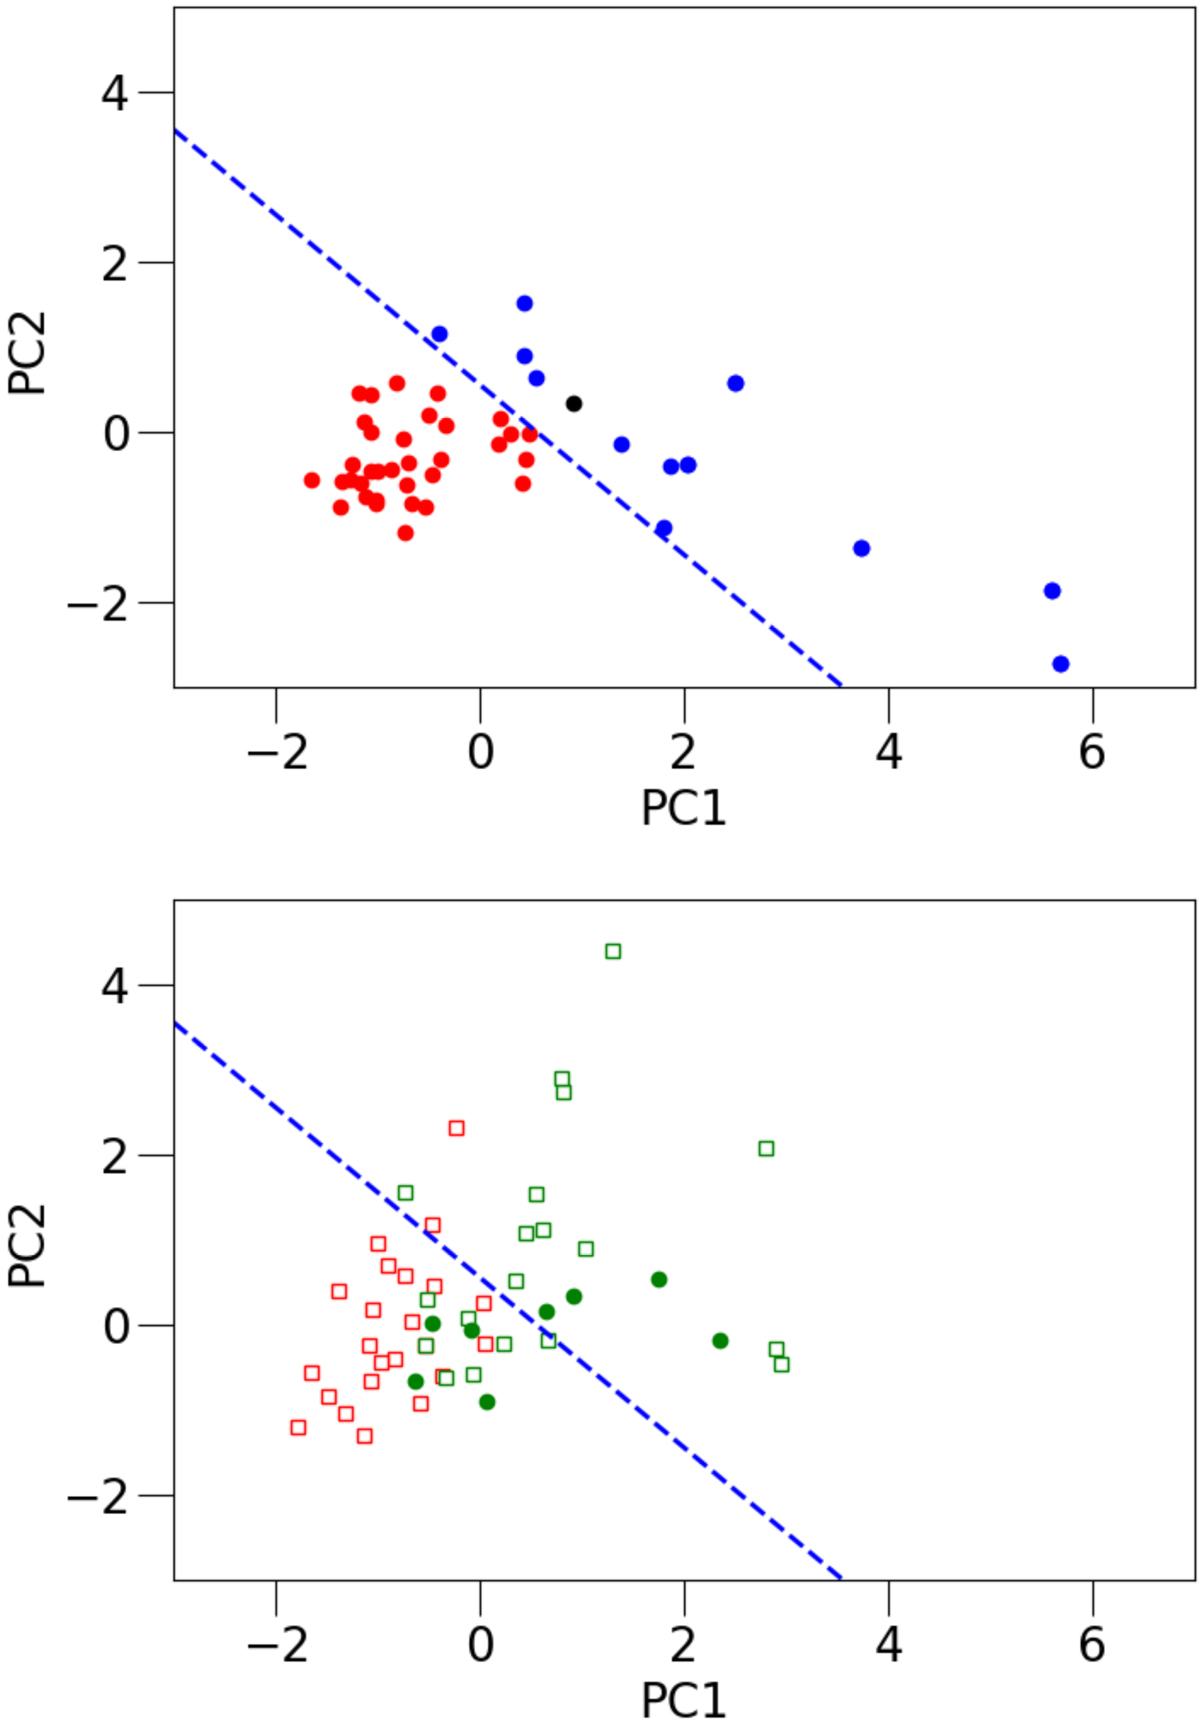
Results of the PCA analysis. The principal components PC1 and PC2 are defined in Eq. (8). Clumps with positive (resp. negative) signals are shown in full circles (resp. empty squares). Top panel: map from the PCA for positive signals. Selected (resp. rejected) clumps are shown in blue (resp. red). The blue dashed straight line shows the limit between selected and rejected clumps and follows the relation PC2 = −1 × PC1 + 0.55. Bottom panel: map for rejected signals: negative signals and side lobes. Side lobes, identified in Sect. 2.4, are shown in green, and the other negative signals not identified as side lobes are indicated in red. We note that side lobes can have a high S/N. Most side lobes correspond to negative signals, but we also eliminate four side lobes with a positive signal.
Current usage metrics show cumulative count of Article Views (full-text article views including HTML views, PDF and ePub downloads, according to the available data) and Abstracts Views on Vision4Press platform.
Data correspond to usage on the plateform after 2015. The current usage metrics is available 48-96 hours after online publication and is updated daily on week days.
Initial download of the metrics may take a while.