Fig. 3.
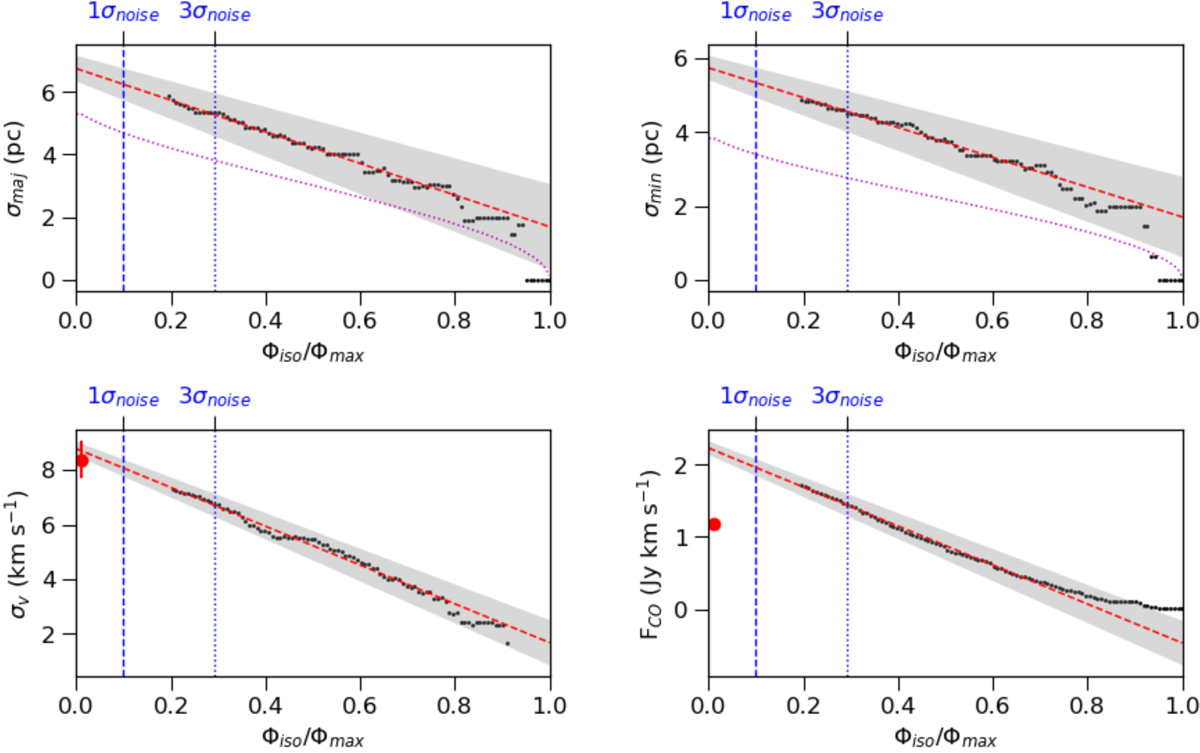
Extrapolation method applied on the highest S/N clump at J2000 coordinates 00h 42m 43.9s and +41 ° 15′ 35.84″ with SNRpeak = 10.3 and SNRtot = 64.4. We perform extrapolations to the 0-level with a linear regression (red dashed line) on the data for spatial size σmaj and σmin (top panels), velocity dispersion σv distribution (bottom left panel), and total flux FCO (bottom right panel). The uncertainty is computed with the bootstrapping method. The blue dashed lines indicate where Φiso/Φmax is equal to 1 and 3σnoise. Since we expect our clumps to be barely resolved, we show as a magenta dashed line the size for a perfect Gaussian PSF, noiseless, and simulated equivalent case. The red dots indicate the values found by fitting a Gaussian for the velocity distribution and total flux. The size over the major and minor axis is slightly larger than that obtained for the simulated clump, which suggests that this clump is barely resolved. The velocity dispersion is about 4 times the spectral resolution (2.2 km s−1). There is a good agreement between the extrapolated velocity dispersions and those directly measured on the spectra, while the total flux is slightly higher for the extrapolation.
Current usage metrics show cumulative count of Article Views (full-text article views including HTML views, PDF and ePub downloads, according to the available data) and Abstracts Views on Vision4Press platform.
Data correspond to usage on the plateform after 2015. The current usage metrics is available 48-96 hours after online publication and is updated daily on week days.
Initial download of the metrics may take a while.