Fig. B.3.
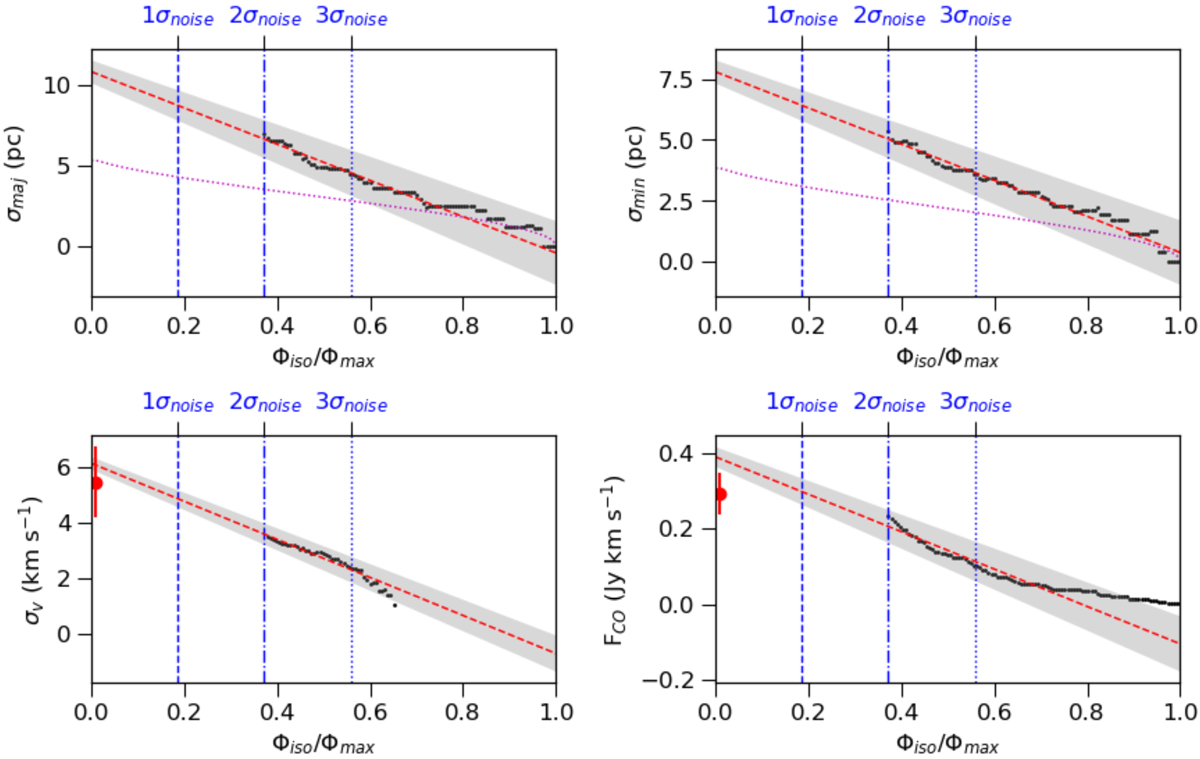
Same as Fig. 3 for one clump at J2000 coordinates 00h 42m 44.52s and +41 ° 16′ 10.1″ with SNRpeak = 5.4 and SNRtot = 15.2. The size over the major and minor axis is twice as high as that obtained from the simulated clump, which suggests this clump is resolved. The velocity dispersion is more than twice the spectral resolution (2.2 km s−1). There is also a good agreement between the extrapolated velocity dispersions, and those measured directly from the spectra, while the total flux is slightly higher for the extrapolation.
Current usage metrics show cumulative count of Article Views (full-text article views including HTML views, PDF and ePub downloads, according to the available data) and Abstracts Views on Vision4Press platform.
Data correspond to usage on the plateform after 2015. The current usage metrics is available 48-96 hours after online publication and is updated daily on week days.
Initial download of the metrics may take a while.