Fig. B.1.
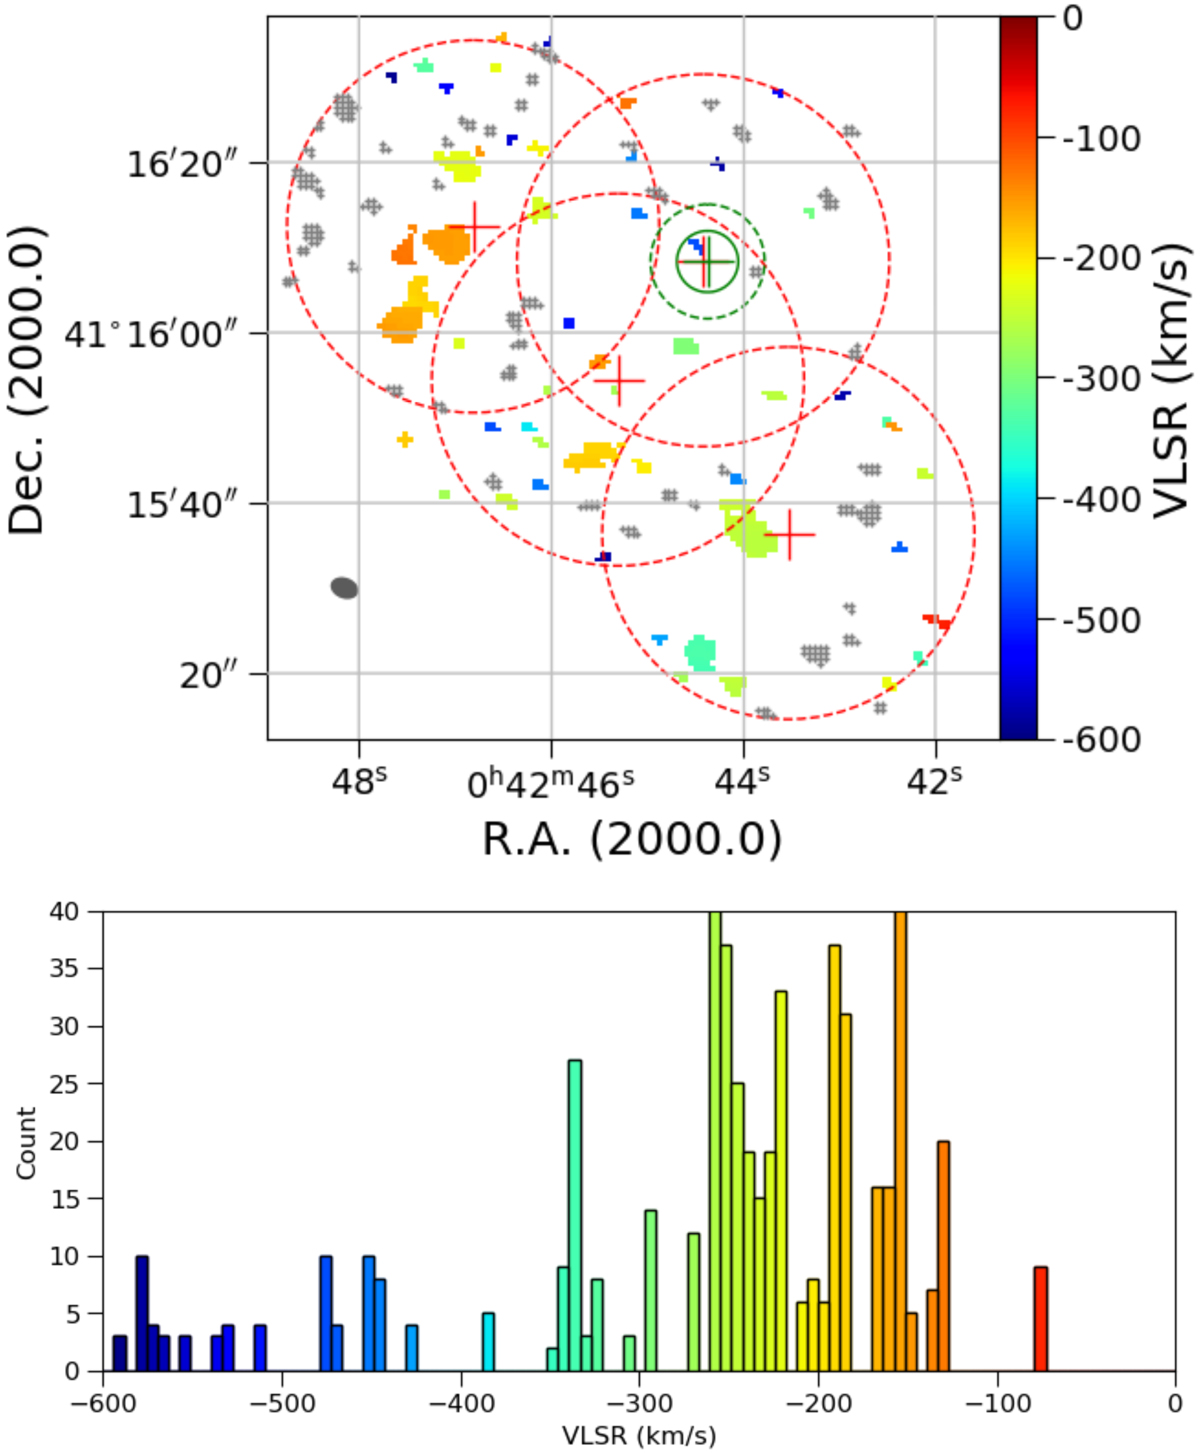
Maps of the velocities core clumps detected (top) and associated velocity distribution (down). The colour-coding for the velocity is the same for the maps and histograms. The velocity values for core clumps with contiguous pixels with more than 2 spectral channels above 3σnoise are shown. Positions of the negative core clumps are indicated as grey crosses. The histograms of velocity reveal some spatial and spectral correspondences. Three core clumps with strong signal in particular can be observed at velocities −157, −187, and −253 km s−1. This is used to apply GILDAS cleaning algorithm on specific channels. Some cores are detected outside of the fields and a few also display abnormal velocities for the region studied (especially one at −76 km s−1). All these clumps are rejected by our selection procedure.
Current usage metrics show cumulative count of Article Views (full-text article views including HTML views, PDF and ePub downloads, according to the available data) and Abstracts Views on Vision4Press platform.
Data correspond to usage on the plateform after 2015. The current usage metrics is available 48-96 hours after online publication and is updated daily on week days.
Initial download of the metrics may take a while.