Open Access
Fig. A.1.
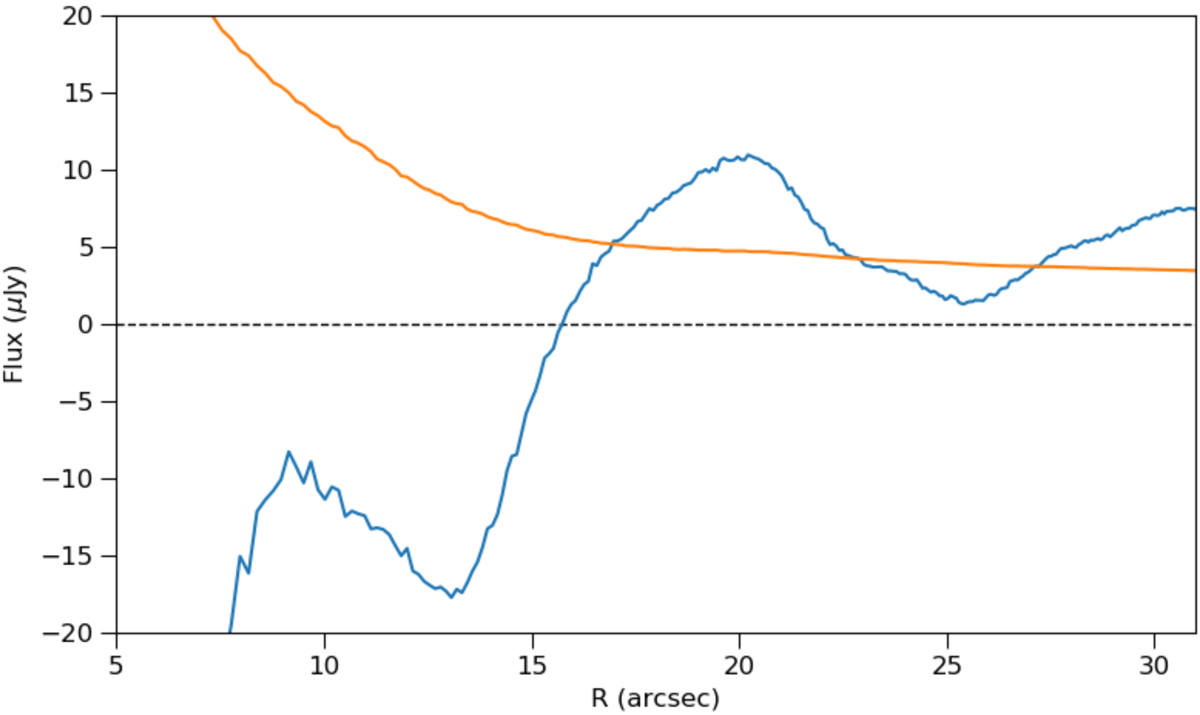
Mean flux (blue line) and associated noise (orange line) in μJy of the spectrum integrated within concentric circles of increasing radius R. Circles are centred on the centre of the field; the channels within the [−600, 0] km s−1 range were removed to avoid influence of the detected clumps.
Current usage metrics show cumulative count of Article Views (full-text article views including HTML views, PDF and ePub downloads, according to the available data) and Abstracts Views on Vision4Press platform.
Data correspond to usage on the plateform after 2015. The current usage metrics is available 48-96 hours after online publication and is updated daily on week days.
Initial download of the metrics may take a while.