Fig. 21.
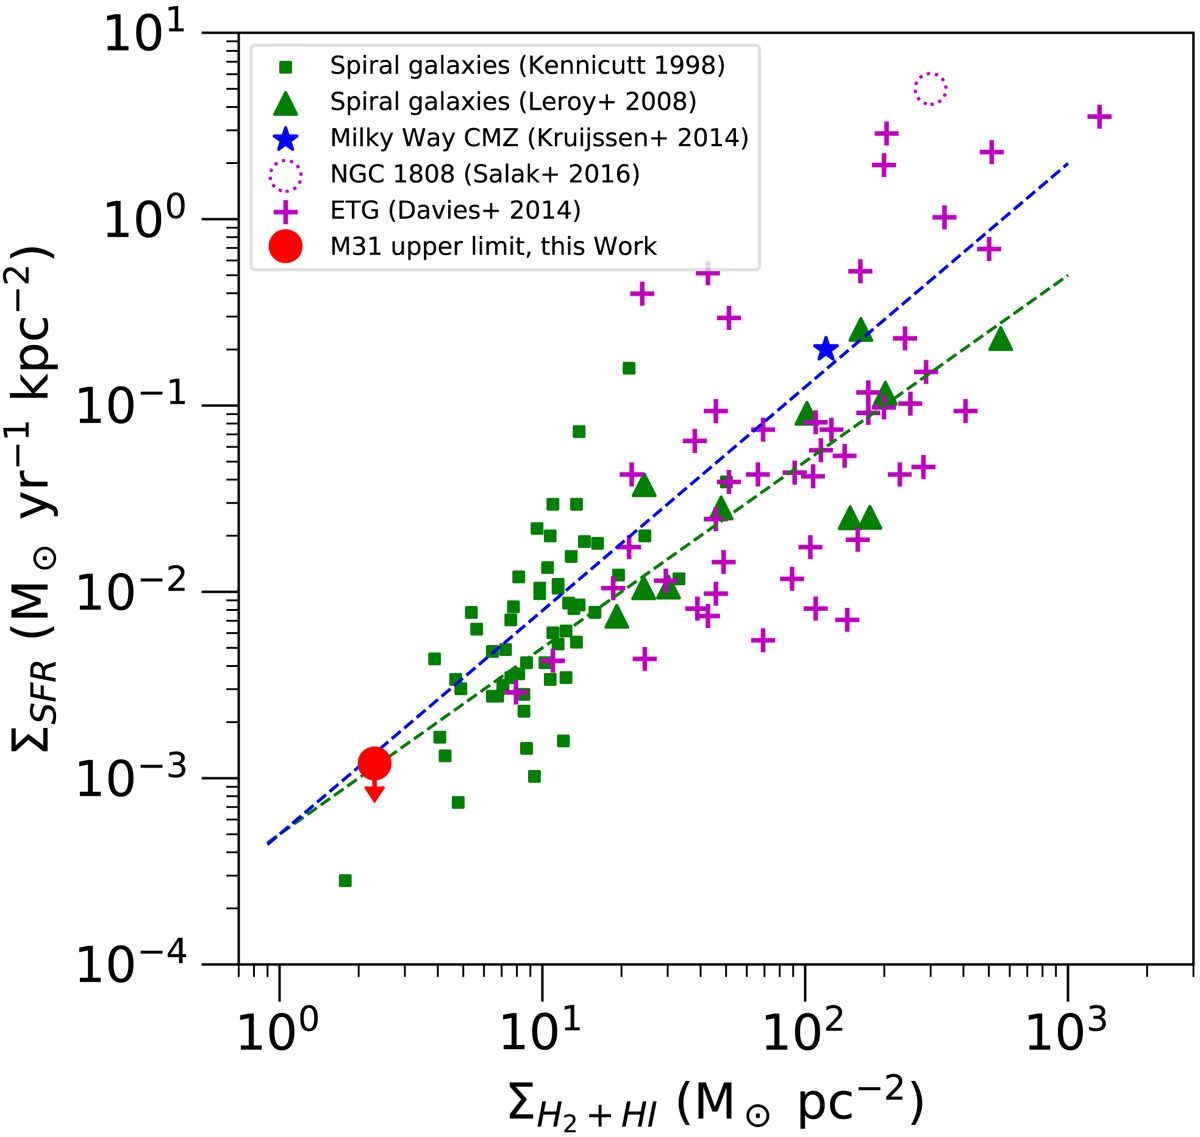
Surface density of SFR with respect to surface density of H2+HI gas for various galaxies. The red filled circle denotes the M 31 circum-nuclear region, where ΣH2 + HI was calculated from our molecular gas measurements, the estimated surface density of HI in the corresponding region of M 31 from Braun et al. (2009) (between 1 and 2 M⊙ pc2), and ΣSFR from our FUV plus 24 μm map shown in the left panel of Fig. 20. The green triangles indicate the central region of spiral galaxies from Leroy et al. (2008). The magenta dotted circle indicates the circum-nuclear region (r < 200 pc) of NGC 1808 with ΣH2 from Salak et al. (2016) and ΣSFR estimated from Krabbe et al. (1994). The magenta crosses indicate the central parts of ETGs from Davis et al. (2014). The green squares indicate spiral galaxies from Kennicutt (1998). The green square close to M 31 denotes NGC 4698, an early-type spiral with a ring-like disc of star formation, and a decoupled nuclear disc (Corsini et al. 2012). The green dashed line indicates the Kennicutt-Schmidt law with a slope N = 1.0, and the blue dashed line indicates the linear regression applied on the whole sample.
Current usage metrics show cumulative count of Article Views (full-text article views including HTML views, PDF and ePub downloads, according to the available data) and Abstracts Views on Vision4Press platform.
Data correspond to usage on the plateform after 2015. The current usage metrics is available 48-96 hours after online publication and is updated daily on week days.
Initial download of the metrics may take a while.