Fig. 18.
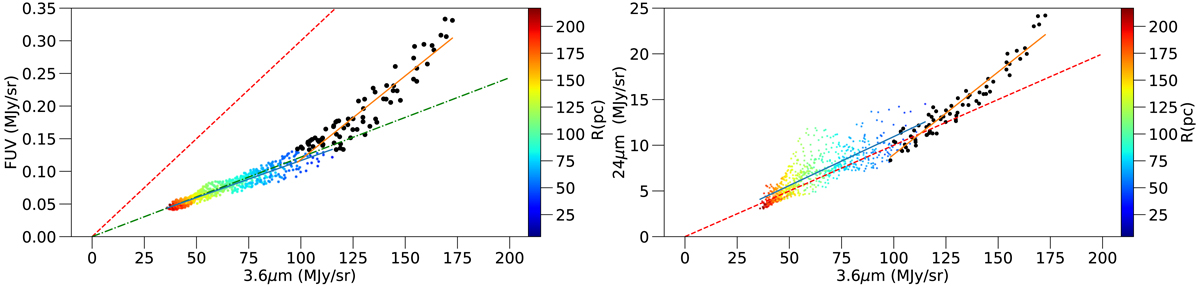
Correlations of the FUV and 24 μm flux with the 3.6 μm flux in the field of view observed with IRAM-PdB. The colour coding corresponds to the radial distance to the centre. The black large points correspond to measurements with a FUV flux (non-corrected for Galactic extinction) larger than 0.09 MJyr sr−1. The red dashed lines correspond to the correction used by Leroy et al. (2013); the green dashed line indicates the correction used by Ford et al. (2013). The blue and orange lines correspond to the linear adjustments performed on the two regions and tentatively used to correct the FUV and 24 μm fluxes from stellar population.
Current usage metrics show cumulative count of Article Views (full-text article views including HTML views, PDF and ePub downloads, according to the available data) and Abstracts Views on Vision4Press platform.
Data correspond to usage on the plateform after 2015. The current usage metrics is available 48-96 hours after online publication and is updated daily on week days.
Initial download of the metrics may take a while.