Fig. 17.
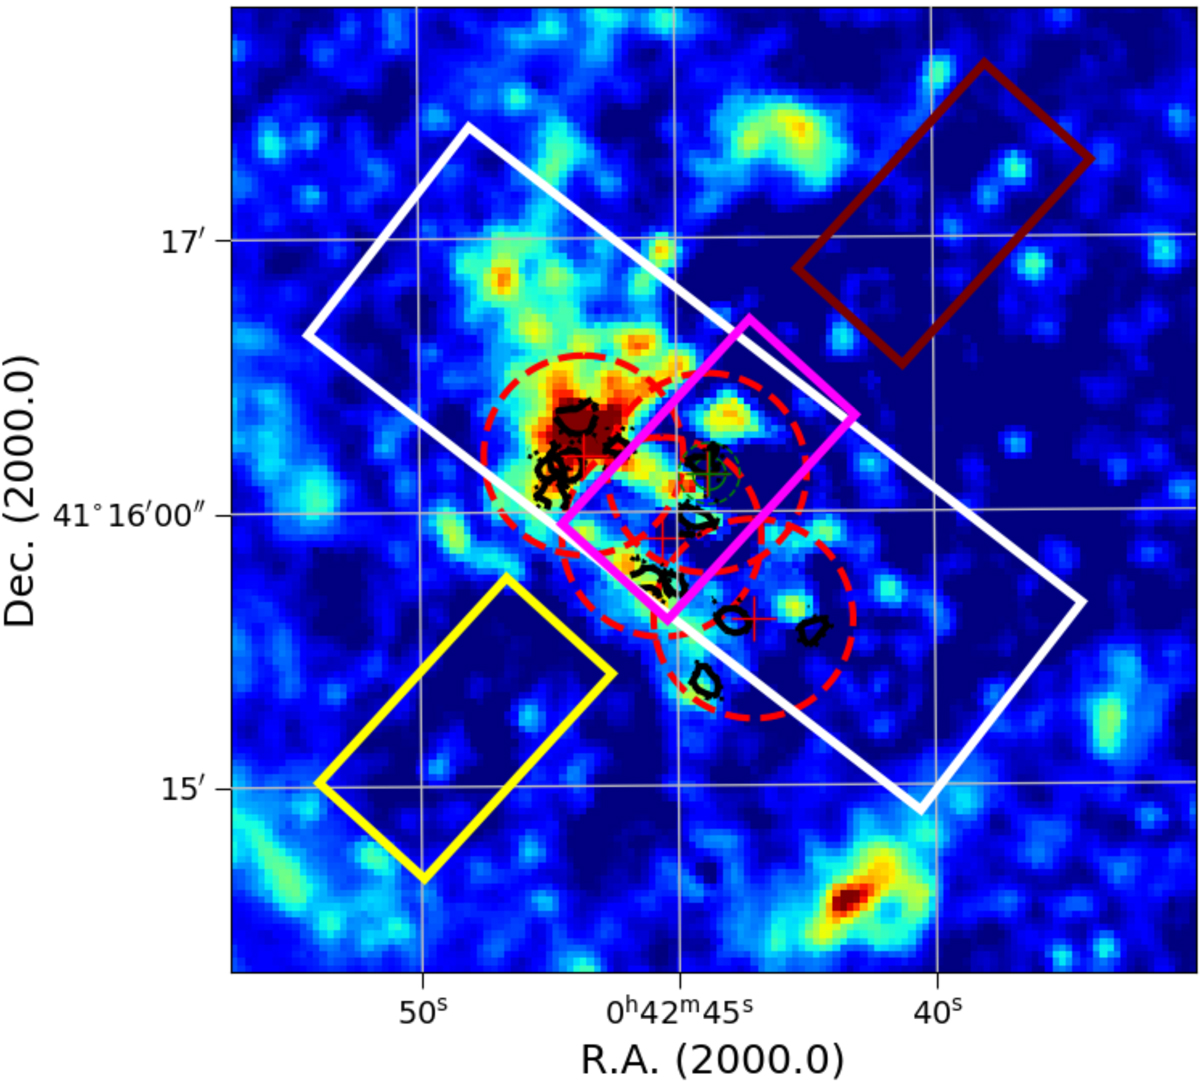
Map of ΣSFR from Ford et al. (2013) on which we show the regions observed with Spitzer/IRS by Hemachandra et al. (2015) with rectangles. Each rectangle corresponds to a region observed by a different module of Spitzer/IRS. The white rectangle corresponds to the LL2 map, the red indicates SL2, the yellow indicates SL1, and the magenta shows an overlapped region between both SL1 and SL2. The dashed red circles indicate the fields of our data cube and the black contours correspond to the selected clumps.
Current usage metrics show cumulative count of Article Views (full-text article views including HTML views, PDF and ePub downloads, according to the available data) and Abstracts Views on Vision4Press platform.
Data correspond to usage on the plateform after 2015. The current usage metrics is available 48-96 hours after online publication and is updated daily on week days.
Initial download of the metrics may take a while.