Fig. 12.
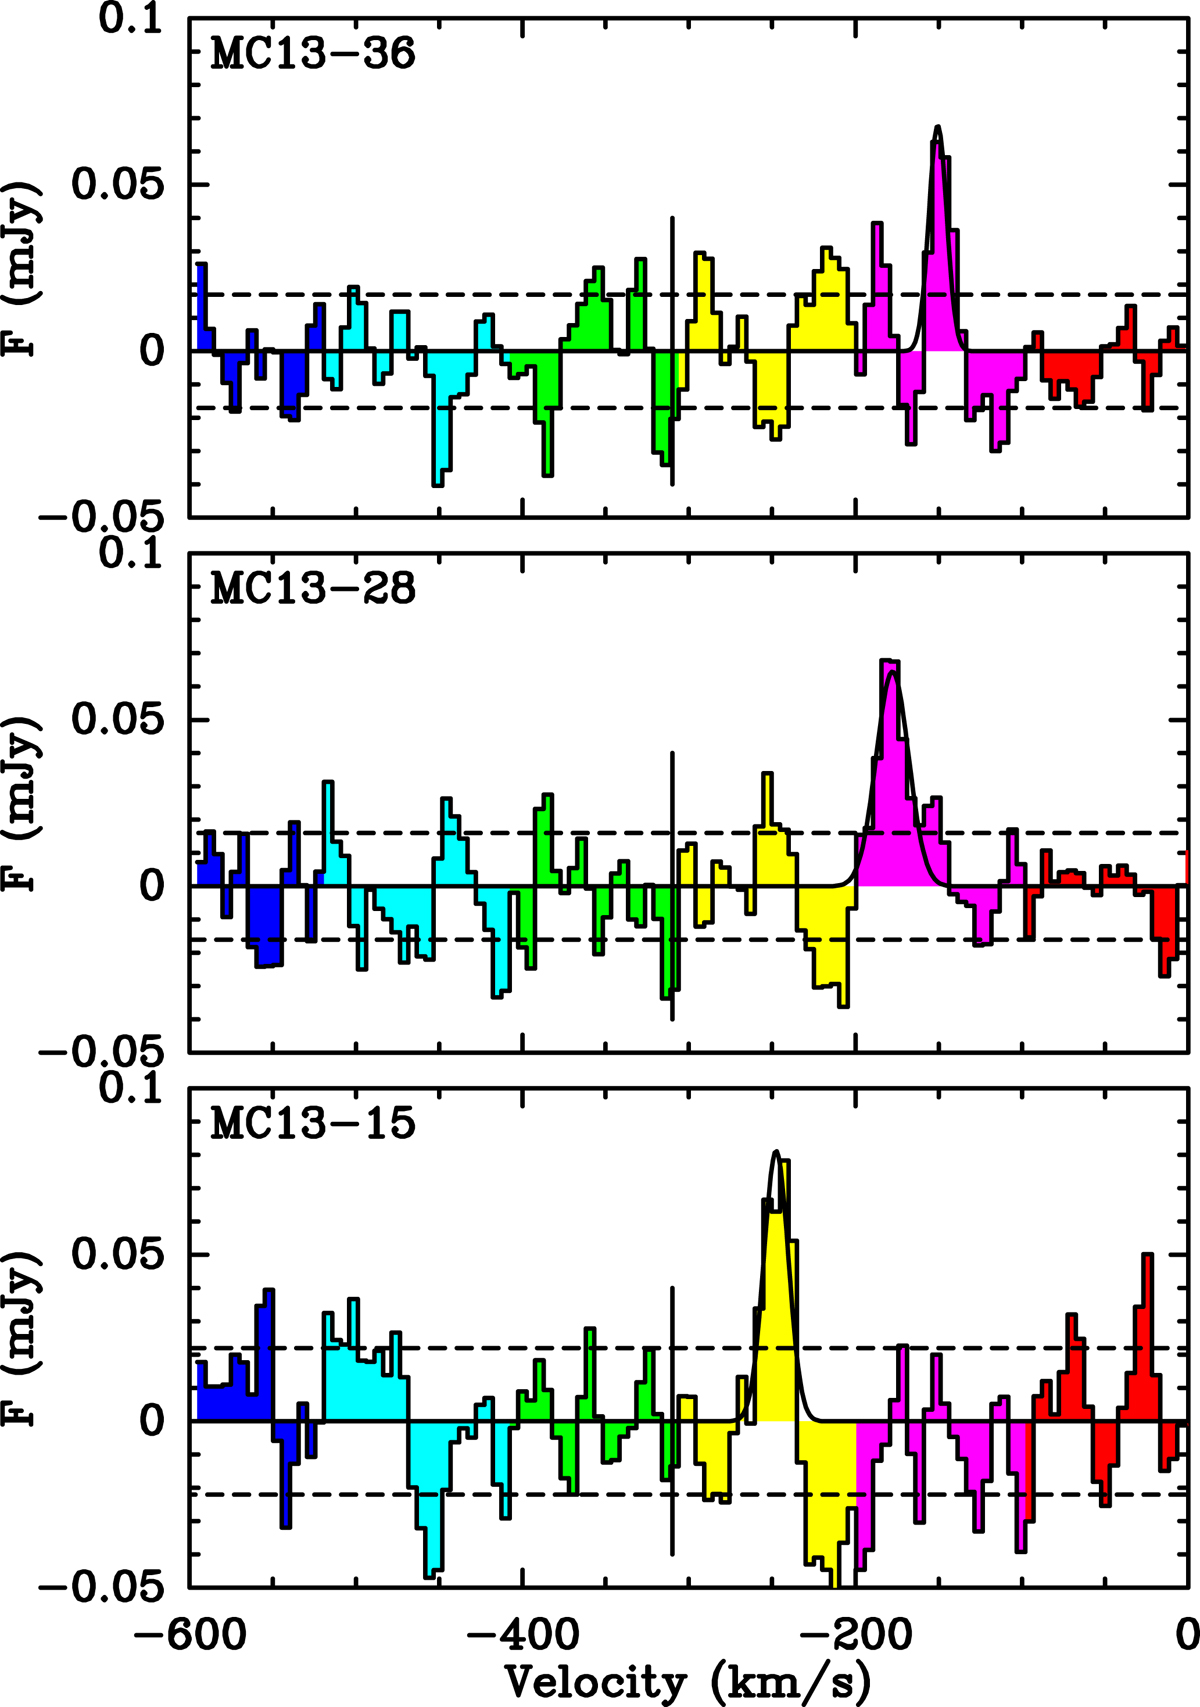
CO(1-0) spectra corresponding to the CO(2-1) detections from Melchior & Combes (2013, hereafter MC13). The PdB IRAM interferometric data is reprojected on the grid of the data cube obtained with HERA on IRAM 30 m telescope as described in MC13. We show the spectra in the 12 arcsec beams shown in the Fig. 11. A vertical line indicates the systemic velocity. In each panel, we show the best Gaussian fit used to integrate the CO line, whose results are listed in Table 5.
Current usage metrics show cumulative count of Article Views (full-text article views including HTML views, PDF and ePub downloads, according to the available data) and Abstracts Views on Vision4Press platform.
Data correspond to usage on the plateform after 2015. The current usage metrics is available 48-96 hours after online publication and is updated daily on week days.
Initial download of the metrics may take a while.