Fig. 9.
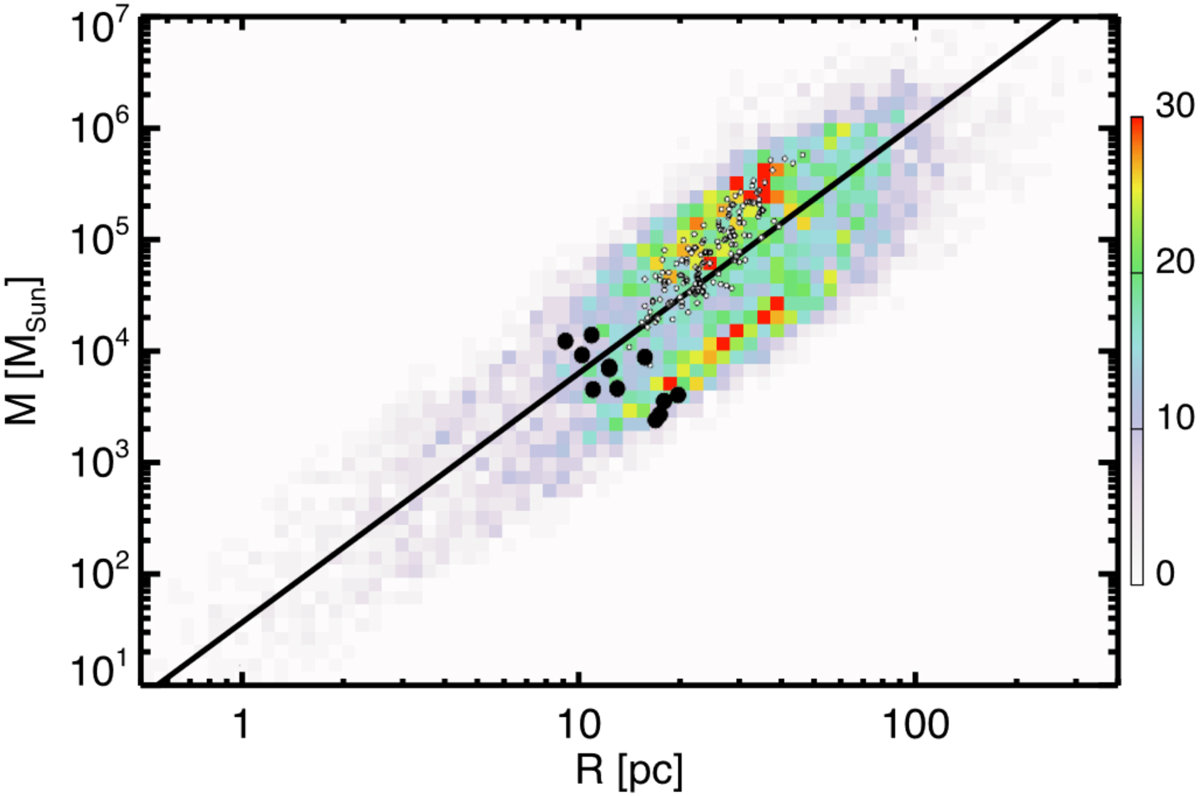
Mass-size relation for the M 31 circum-nuclear clumps (large full black symbols) superposed on the relation obtained for Milky Way clouds by Miville-Deschênes et al. (2017). The colour scale is proportional to the density of points. The solid line indicates a linear fit of slope 2.2. The small empty symbols denote the clouds identified in Centaurus A northern filament by Salomé et al. (2017).
Current usage metrics show cumulative count of Article Views (full-text article views including HTML views, PDF and ePub downloads, according to the available data) and Abstracts Views on Vision4Press platform.
Data correspond to usage on the plateform after 2015. The current usage metrics is available 48-96 hours after online publication and is updated daily on week days.
Initial download of the metrics may take a while.