Fig. 1.
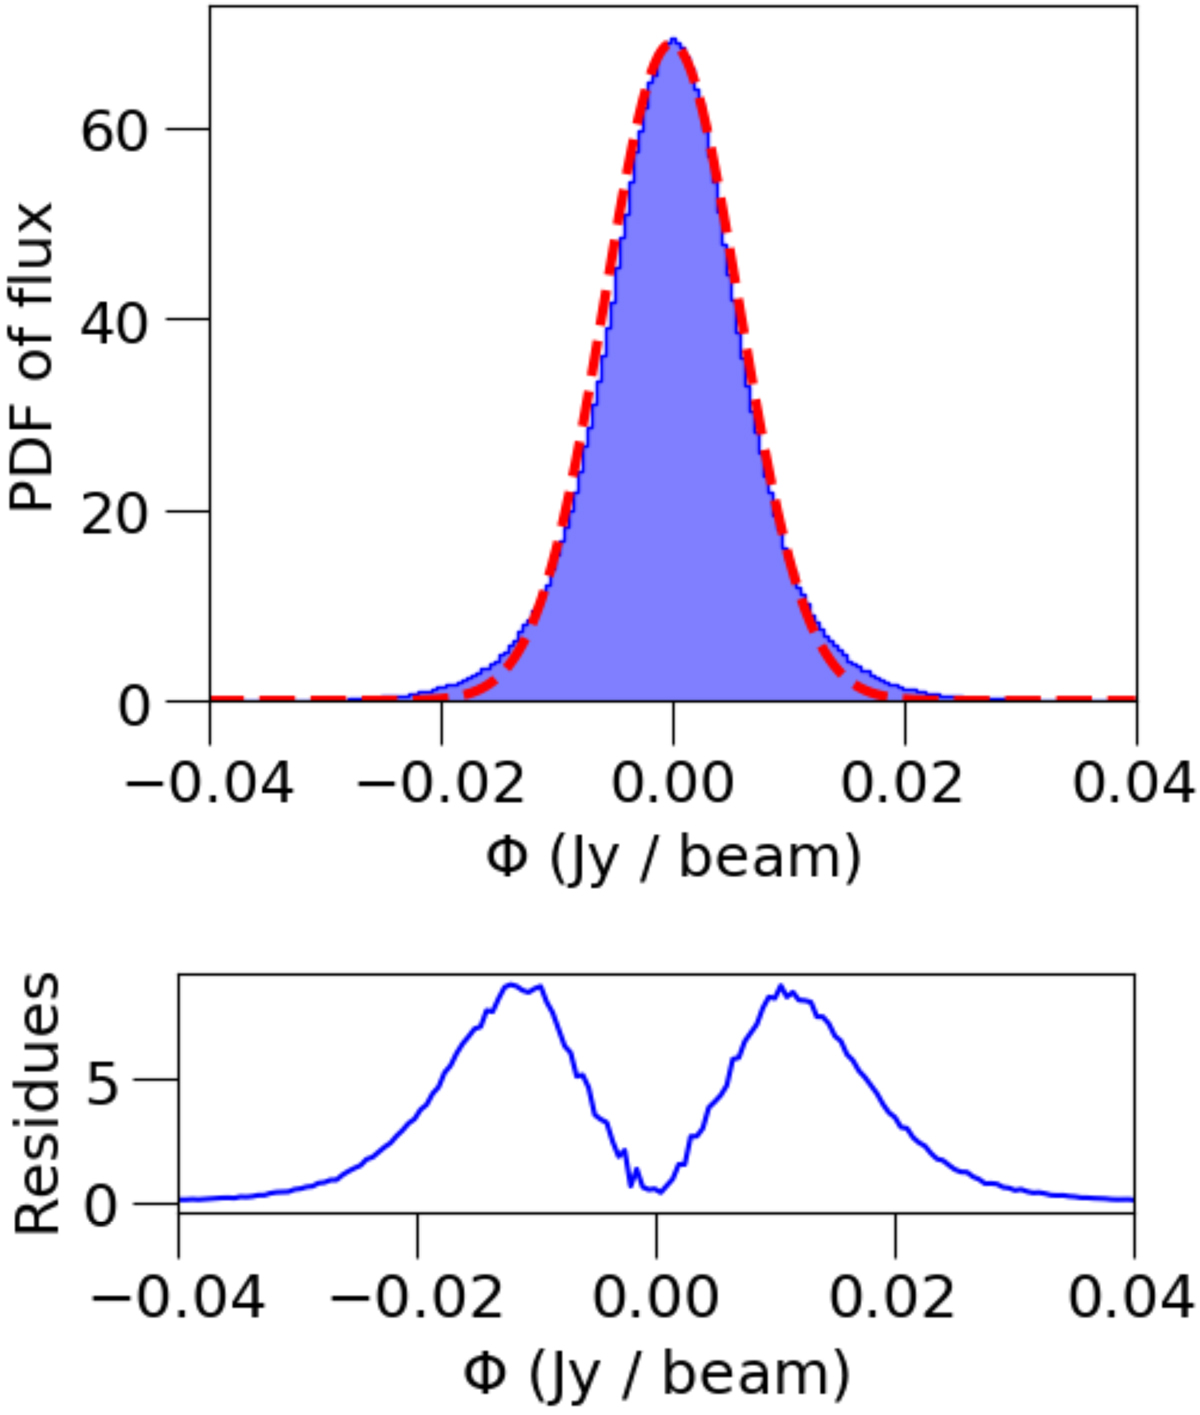
Top: probability density function of the distribution of fluxes within the data cube and the associated Gaussian fit (red dashed curve). The value ϕ corresponds to the flux of each pixel (in the 3D data cube), and the spatial variation of the noise has not been corrected at this stage. Bottom: residues associated with the distribution and its Gaussian fit. We observe that the distribution is not Gaussian, which we expect from a cube containing a signal. The residues are mostly symmetrical, showing that the signal is very faint and needs advanced detection methods.
Current usage metrics show cumulative count of Article Views (full-text article views including HTML views, PDF and ePub downloads, according to the available data) and Abstracts Views on Vision4Press platform.
Data correspond to usage on the plateform after 2015. The current usage metrics is available 48-96 hours after online publication and is updated daily on week days.
Initial download of the metrics may take a while.