Fig. A.1.
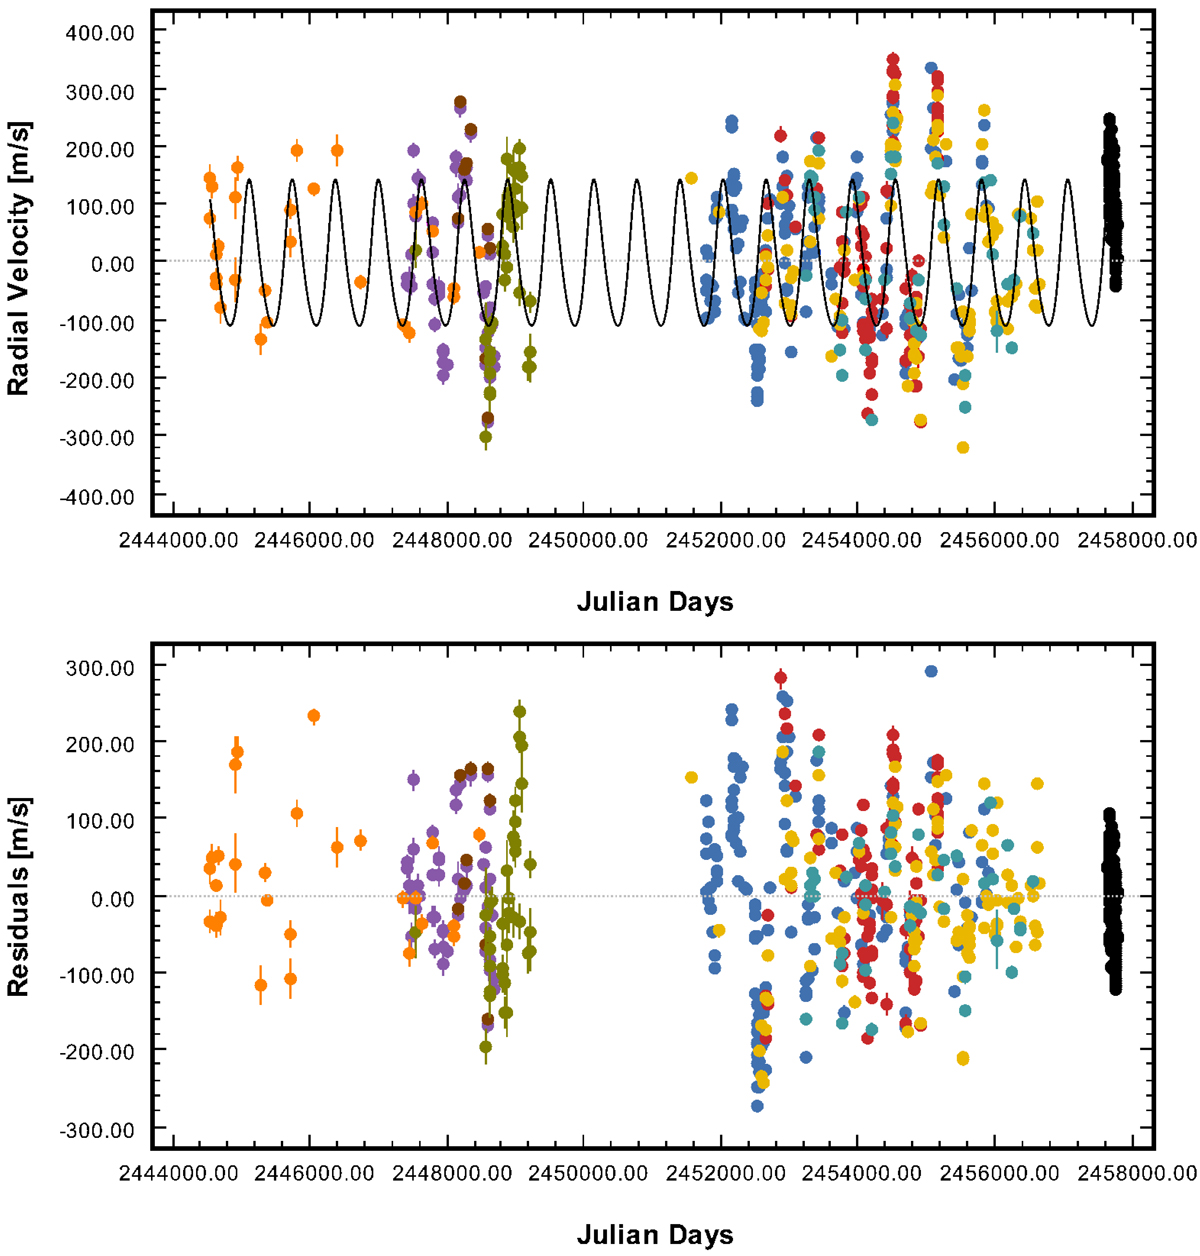
All available RV data sets for Aldebaran, i.e. all the H15 data sets plus the ones from Lick (in blue) and Song (in black), with the planet fit from Farr et al. (2018) overplotted in the upper panel. Lower panel: residuals to that fit. As one can see, the phase of the periodic planet signal does not match during the time frame from about 2002 to 2005, shortly after the long gap in the overall RV time series. This mismatch can also be seen in the residuals plot; during that same time frame from about 2002 to 2005 the residuals are larger than at other times.
Current usage metrics show cumulative count of Article Views (full-text article views including HTML views, PDF and ePub downloads, according to the available data) and Abstracts Views on Vision4Press platform.
Data correspond to usage on the plateform after 2015. The current usage metrics is available 48-96 hours after online publication and is updated daily on week days.
Initial download of the metrics may take a while.