Fig. 5.
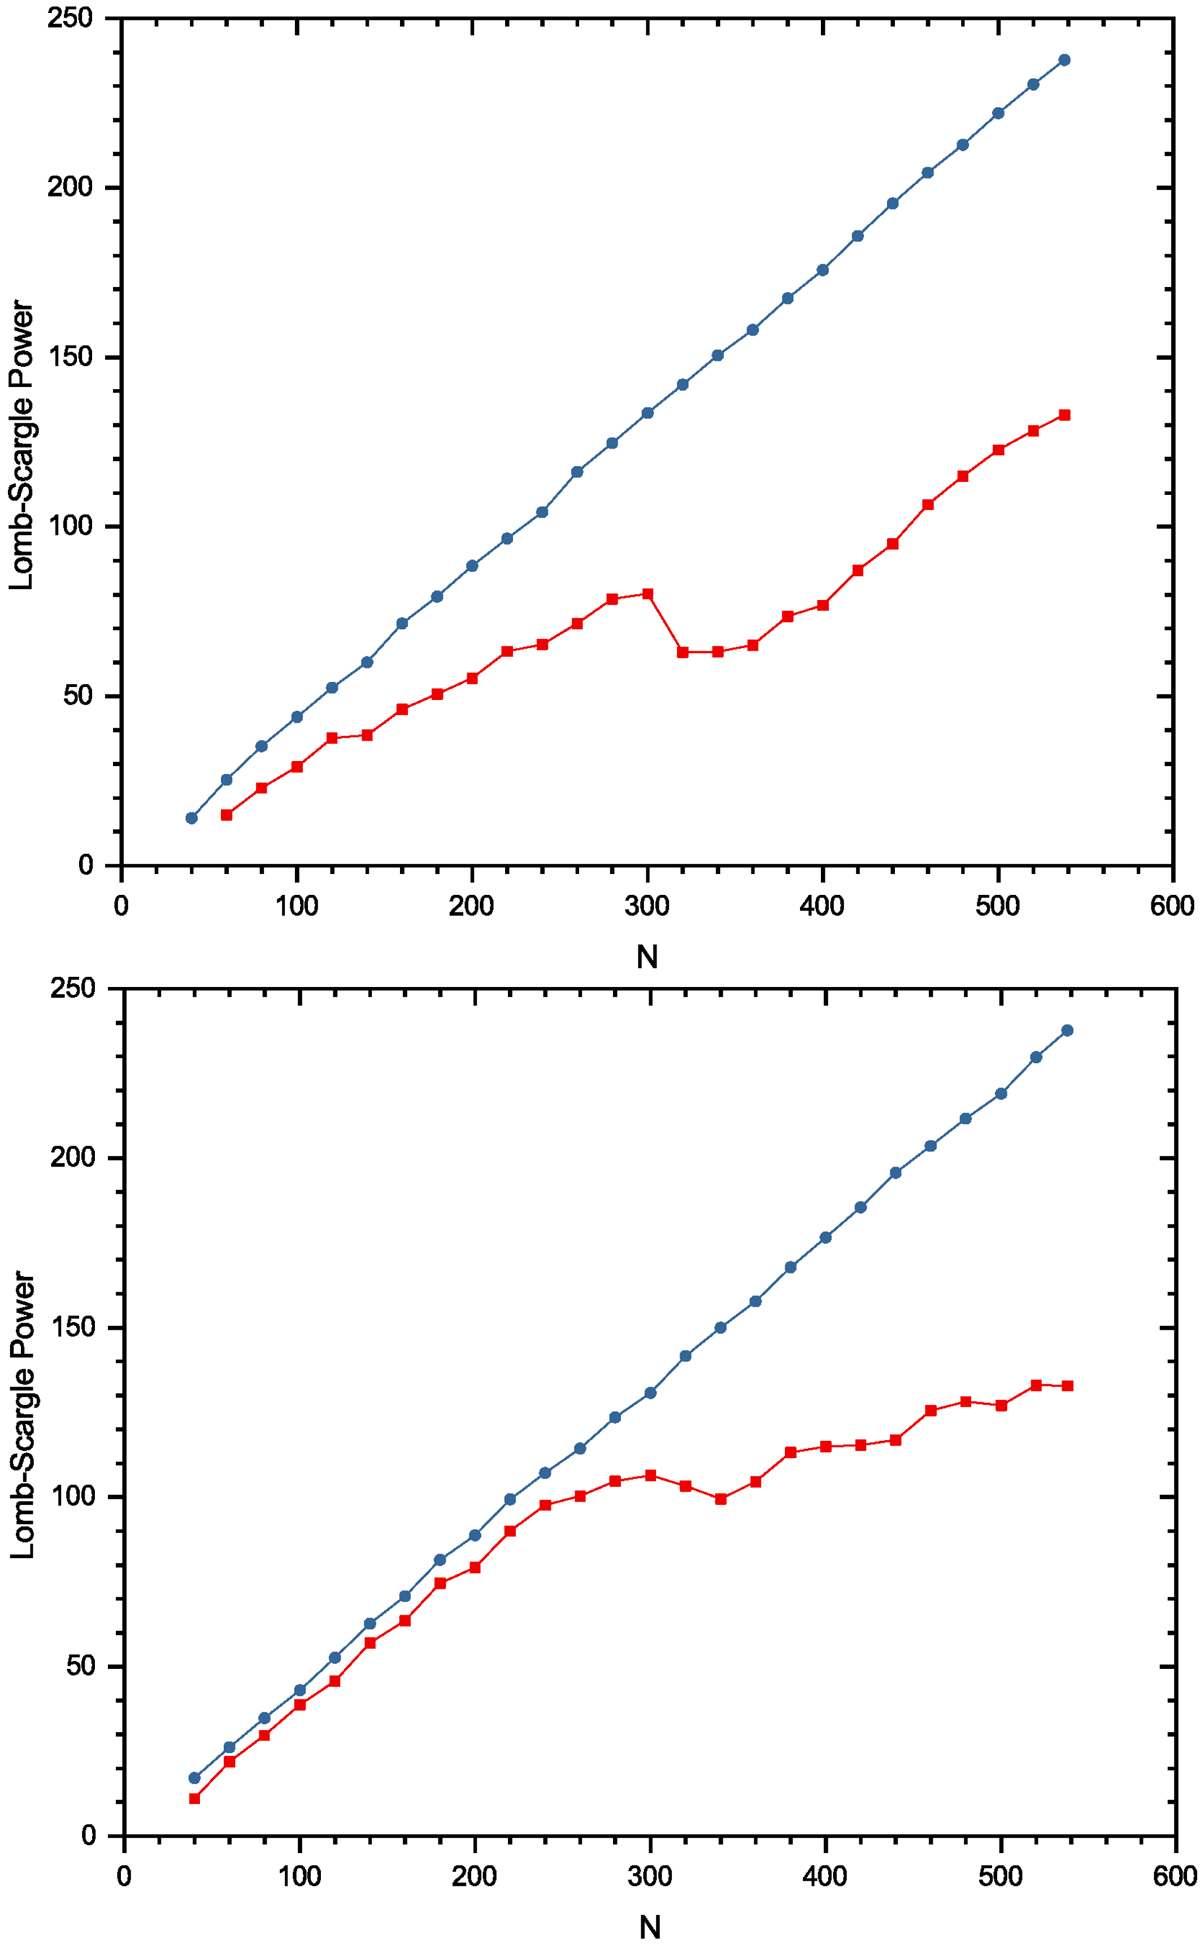
Lomb-Scargle power of the 625 d period as a function of the number of data points (N). The red squared data points represent the real data while the blue circular data points represent simulated data. Top: growth of the Lomb-Scargle power from 1980–2013. Data points were added in steps of 20 in chronological order. A decrease in statistical power is observable for the real data between N = 300 and N = 320. Bottom: growth of the Lomb-Scargle power from 2013–1980. Data points were added in steps of 20 in reversed chronological order. Before N = 240 (which represent the newest RV data) the ∼620 d period is clearly visible as the growth in power shows the same linear slope as the simulated data. The older RV data (taken before 2006) however cause a decrease in the slope and a drop in power at N = 340.
Current usage metrics show cumulative count of Article Views (full-text article views including HTML views, PDF and ePub downloads, according to the available data) and Abstracts Views on Vision4Press platform.
Data correspond to usage on the plateform after 2015. The current usage metrics is available 48-96 hours after online publication and is updated daily on week days.
Initial download of the metrics may take a while.