Fig. 15.
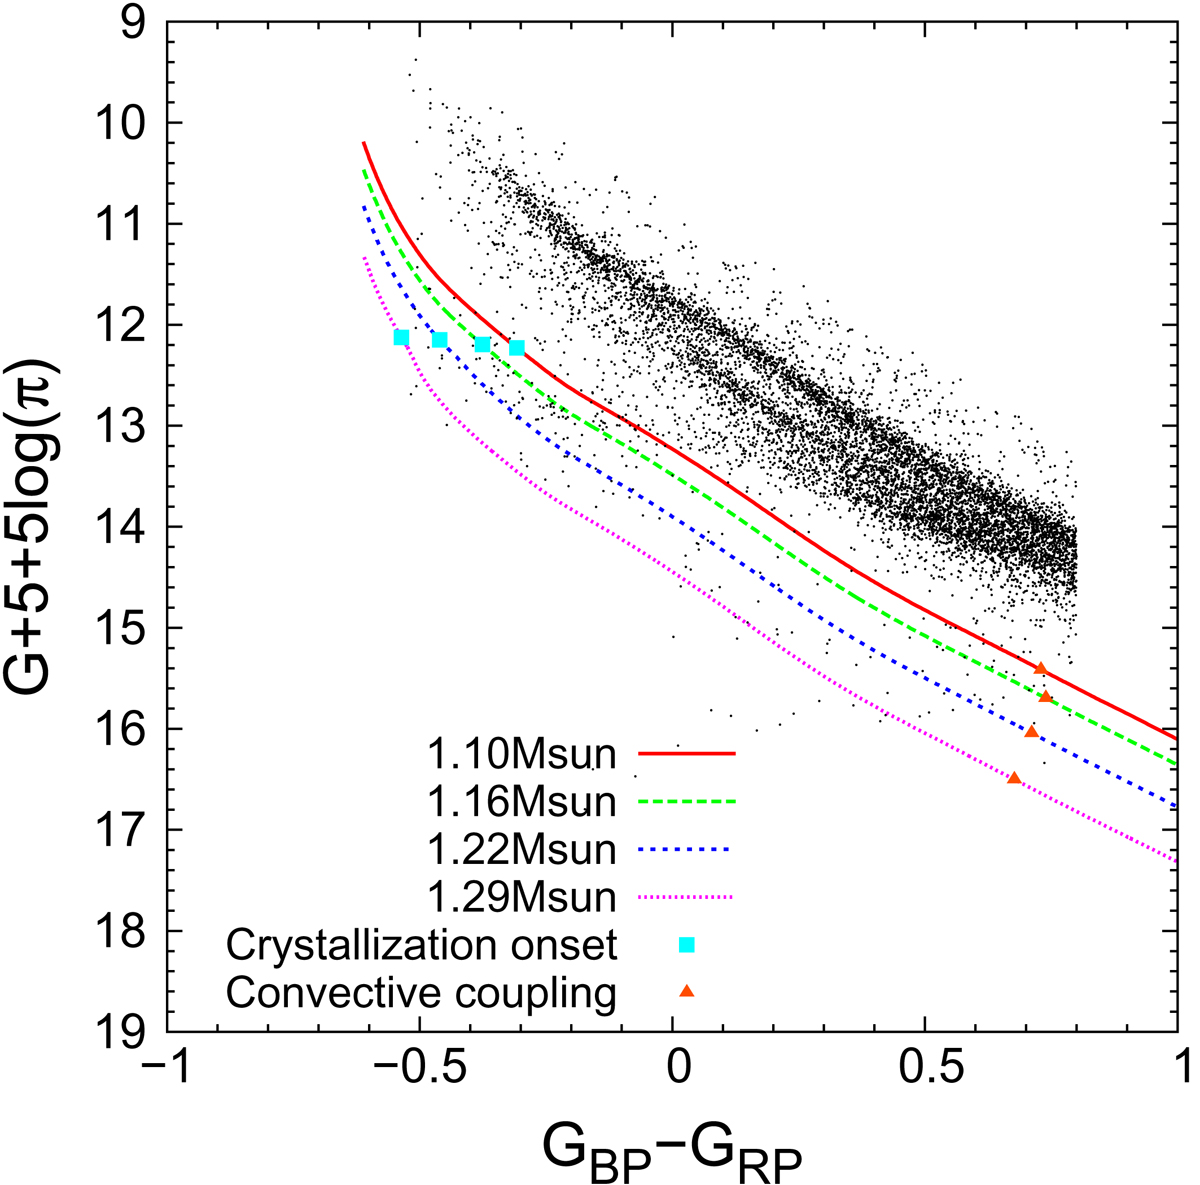
H-rich white dwarf cooling sequences in the color-magnitude diagram in Gaia bands, together with the sample of white dwarfs within 100 pc, obtained by Jiménez-Esteban et al. (2018). The filled squares indicate the moment when crystallization begins in each white dwarf cooling sequence and the filled triangles indicate the moment when convective coupling occurs.
Current usage metrics show cumulative count of Article Views (full-text article views including HTML views, PDF and ePub downloads, according to the available data) and Abstracts Views on Vision4Press platform.
Data correspond to usage on the plateform after 2015. The current usage metrics is available 48-96 hours after online publication and is updated daily on week days.
Initial download of the metrics may take a while.