Free Access
Fig. 5
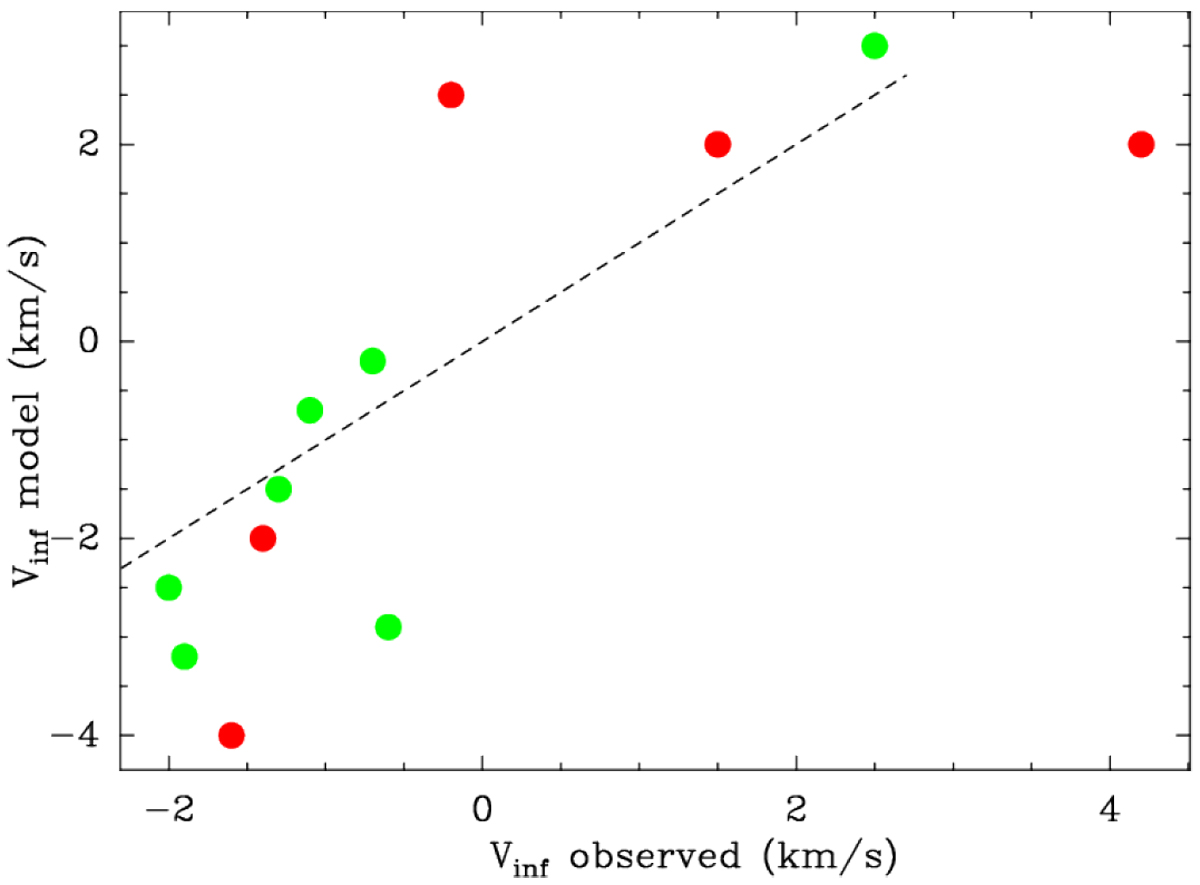
Infall velocities estimated from peak shift between H![]() O and C18 O lines vs. values from detailed fits to H2O line profiles (using RATRAN) by Herpin et al. (2016) (green) and Choi (2015) (red). The dashed line denotes 1:1 correspondence.
O and C18 O lines vs. values from detailed fits to H2O line profiles (using RATRAN) by Herpin et al. (2016) (green) and Choi (2015) (red). The dashed line denotes 1:1 correspondence.
Current usage metrics show cumulative count of Article Views (full-text article views including HTML views, PDF and ePub downloads, according to the available data) and Abstracts Views on Vision4Press platform.
Data correspond to usage on the plateform after 2015. The current usage metrics is available 48-96 hours after online publication and is updated daily on week days.
Initial download of the metrics may take a while.