Fig. 2
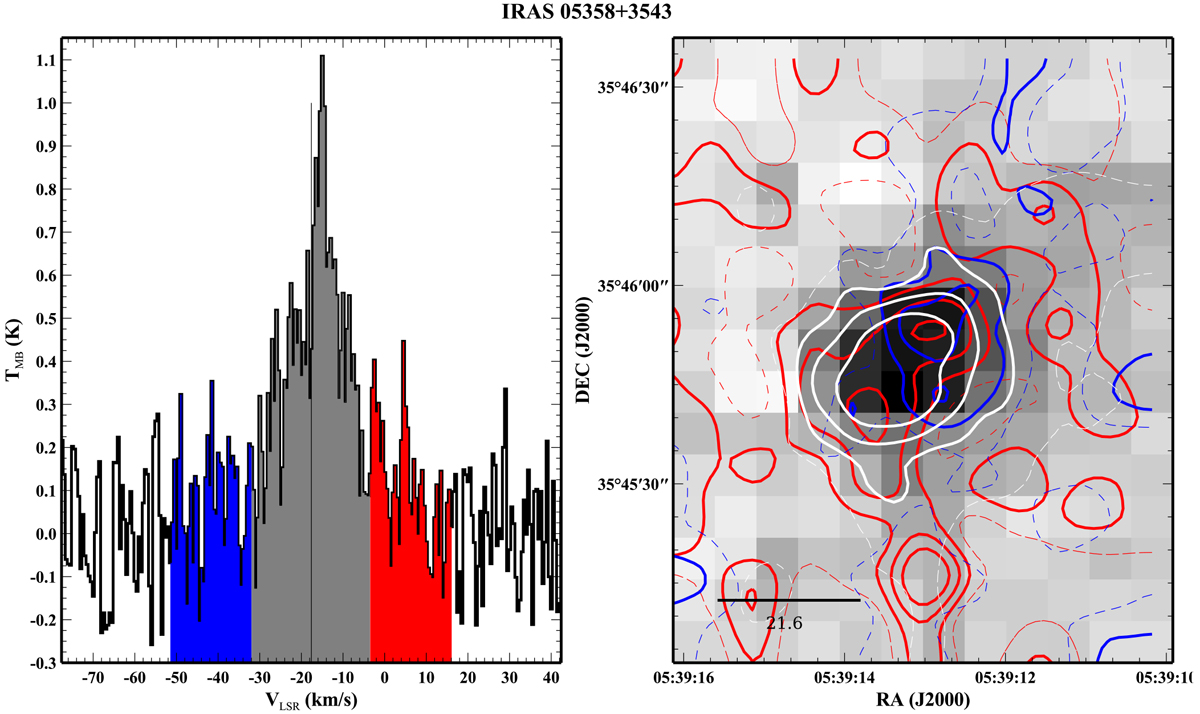
Map of the velocity-integrated emission in the H2O 987 GHz line for IRAS 05358. White contours and grayscale image denote velocity-integrated emission over the range indicated by the gray area in the spectrum in the left panel. Red and blue contours denote red- and blueshifted emission, indicated by the red and blue areas in the left panel. The red and blue maps were created by integrating the 987 GHz data cube over a range of 1 FWHM below and above the VLSR of the envelope, denoted by the vertical black line in the spectrum. The integration ranges are offset by 1/2 FWHM from the VLSR to avoid confusion with absorption features. The lowest contour (at the 1σ level) is drawn dashed, the others (in multiples of σ) are drawn solid. The bar in the bottom left corner denotes the HIFI beam size.
Current usage metrics show cumulative count of Article Views (full-text article views including HTML views, PDF and ePub downloads, according to the available data) and Abstracts Views on Vision4Press platform.
Data correspond to usage on the plateform after 2015. The current usage metrics is available 48-96 hours after online publication and is updated daily on week days.
Initial download of the metrics may take a while.