Fig. 1
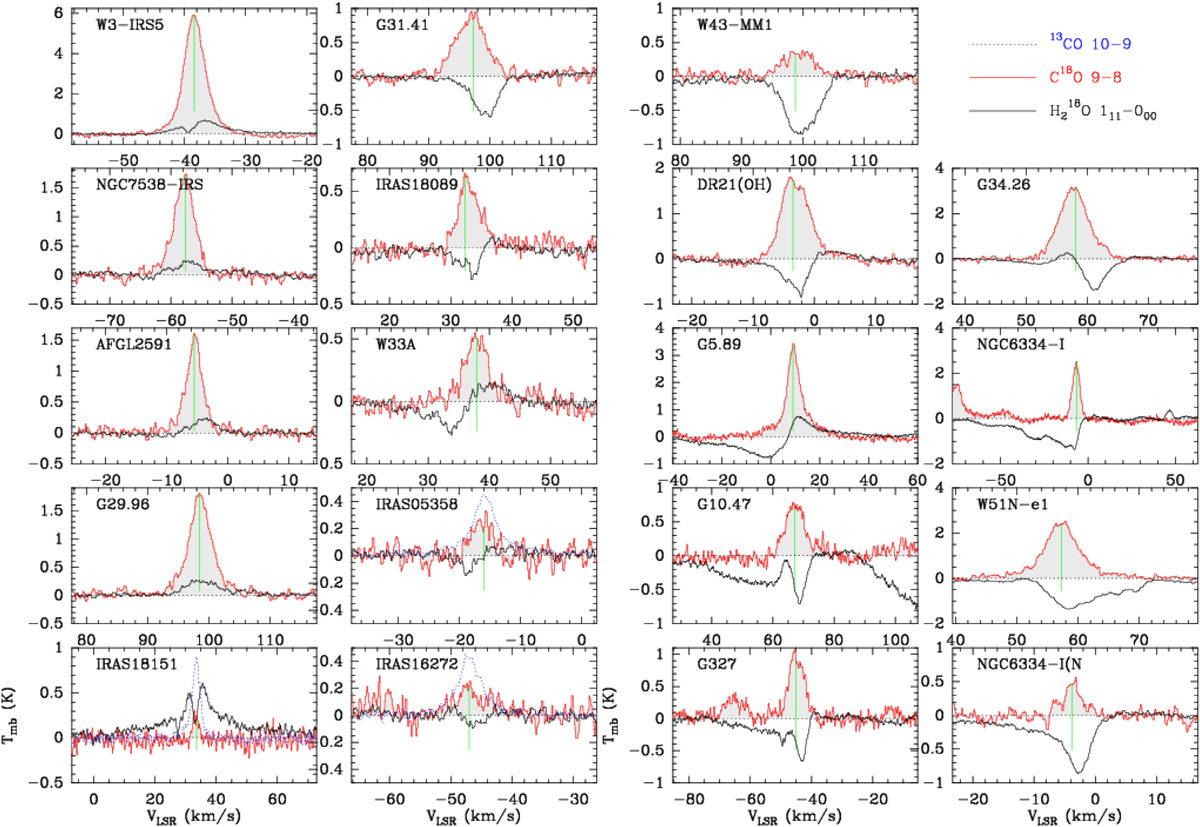
Line profiles of H![]() O 111–000
(black) and C18O 9–8 (red) towardour 19 sources. The vertical green line denotes the C18O velocity in Table 3. For IRAS 18151, we show H2O 111–000
instead of the H
O 111–000
(black) and C18O 9–8 (red) towardour 19 sources. The vertical green line denotes the C18O velocity in Table 3. For IRAS 18151, we show H2O 111–000
instead of the H![]() O line which is not detected. For IRAS 18151, IRAS 16272 and IRAS 05358, the blue dotted spectrum is 13CO 10–9 as C18 O is weak or noisy. The dip in the G10.47 spectrum at VLSR > 80 km s−1 is an artifact from the image sideband.
O line which is not detected. For IRAS 18151, IRAS 16272 and IRAS 05358, the blue dotted spectrum is 13CO 10–9 as C18 O is weak or noisy. The dip in the G10.47 spectrum at VLSR > 80 km s−1 is an artifact from the image sideband.
Current usage metrics show cumulative count of Article Views (full-text article views including HTML views, PDF and ePub downloads, according to the available data) and Abstracts Views on Vision4Press platform.
Data correspond to usage on the plateform after 2015. The current usage metrics is available 48-96 hours after online publication and is updated daily on week days.
Initial download of the metrics may take a while.