Fig. 7.
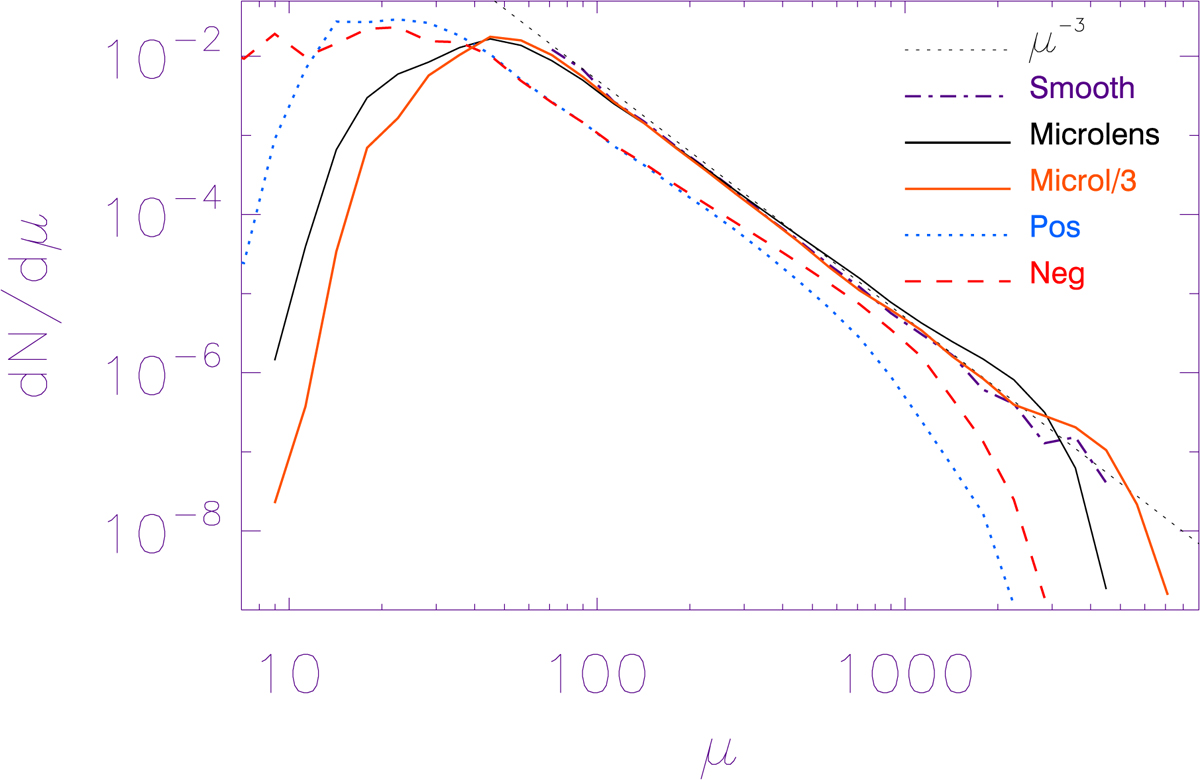
Probability of magnification in the source plane. The black solid line shows the probability of the total magnification when microlenses are present. The black dot-dashed line shows the probability computed in the same area, but when microlenses are not included (i.e., the smooth model). The black dotted line is the μ−3 law expected for smooth caustics. The blue dotted and red dashed curves are the probability of magnification from the regions with positive and negative parity, respectively.
Current usage metrics show cumulative count of Article Views (full-text article views including HTML views, PDF and ePub downloads, according to the available data) and Abstracts Views on Vision4Press platform.
Data correspond to usage on the plateform after 2015. The current usage metrics is available 48-96 hours after online publication and is updated daily on week days.
Initial download of the metrics may take a while.