Fig. 11.
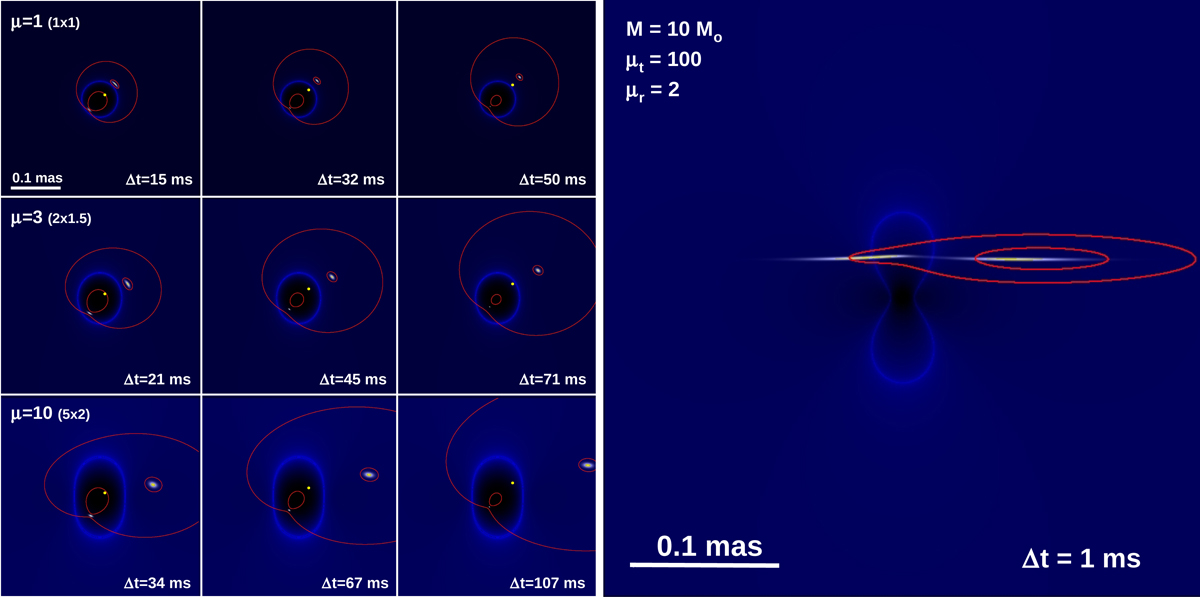
Time delay between the brightest counterimages (GW) produced by microlensing. The group of nine figures on the left is for a microlens of mass 400 M⊙ at z = 0.5 and a source at z = 1.5. Magnification in the lens plane is shown in blue/black. The critical curve can be seen as the bright blue contour. The multiply lensed images are shown in white. Each row corresponds to a different magnification. The numbers in parentheses next to the magnification indicate the tangential and radial magnifications respectively (i.e., μt × μr). The microlens is isolated in the top row ( μ = 1) and embedded in a potential from a macrolens with magnification μ = 3 (middle row) and μ = 10 (bottom row). Each column represents a different source position (marked with a small yellow dot). The red contours are isochrones. The time difference between isochrones is given in the bottom right corner of each panel. The right figure shows one example of a much lighter microlens (with mass 10 M⊙), but much closer to the macrolens critical curve. In particular, the macro-magnification at this position is 200 (100 in the tangential direction and 2 in the radial direction). The redshifts are the same as in the left panels. For this configuration, the time delay between microimages is on the order of 1 millisecond. The source is much closer to the center of the caustic, hence the smaller time delay. Since the microcaustic is smaller, at separations from the center of the microcaustic similar to those on the left side, no multiple images are produced.
Current usage metrics show cumulative count of Article Views (full-text article views including HTML views, PDF and ePub downloads, according to the available data) and Abstracts Views on Vision4Press platform.
Data correspond to usage on the plateform after 2015. The current usage metrics is available 48-96 hours after online publication and is updated daily on week days.
Initial download of the metrics may take a while.