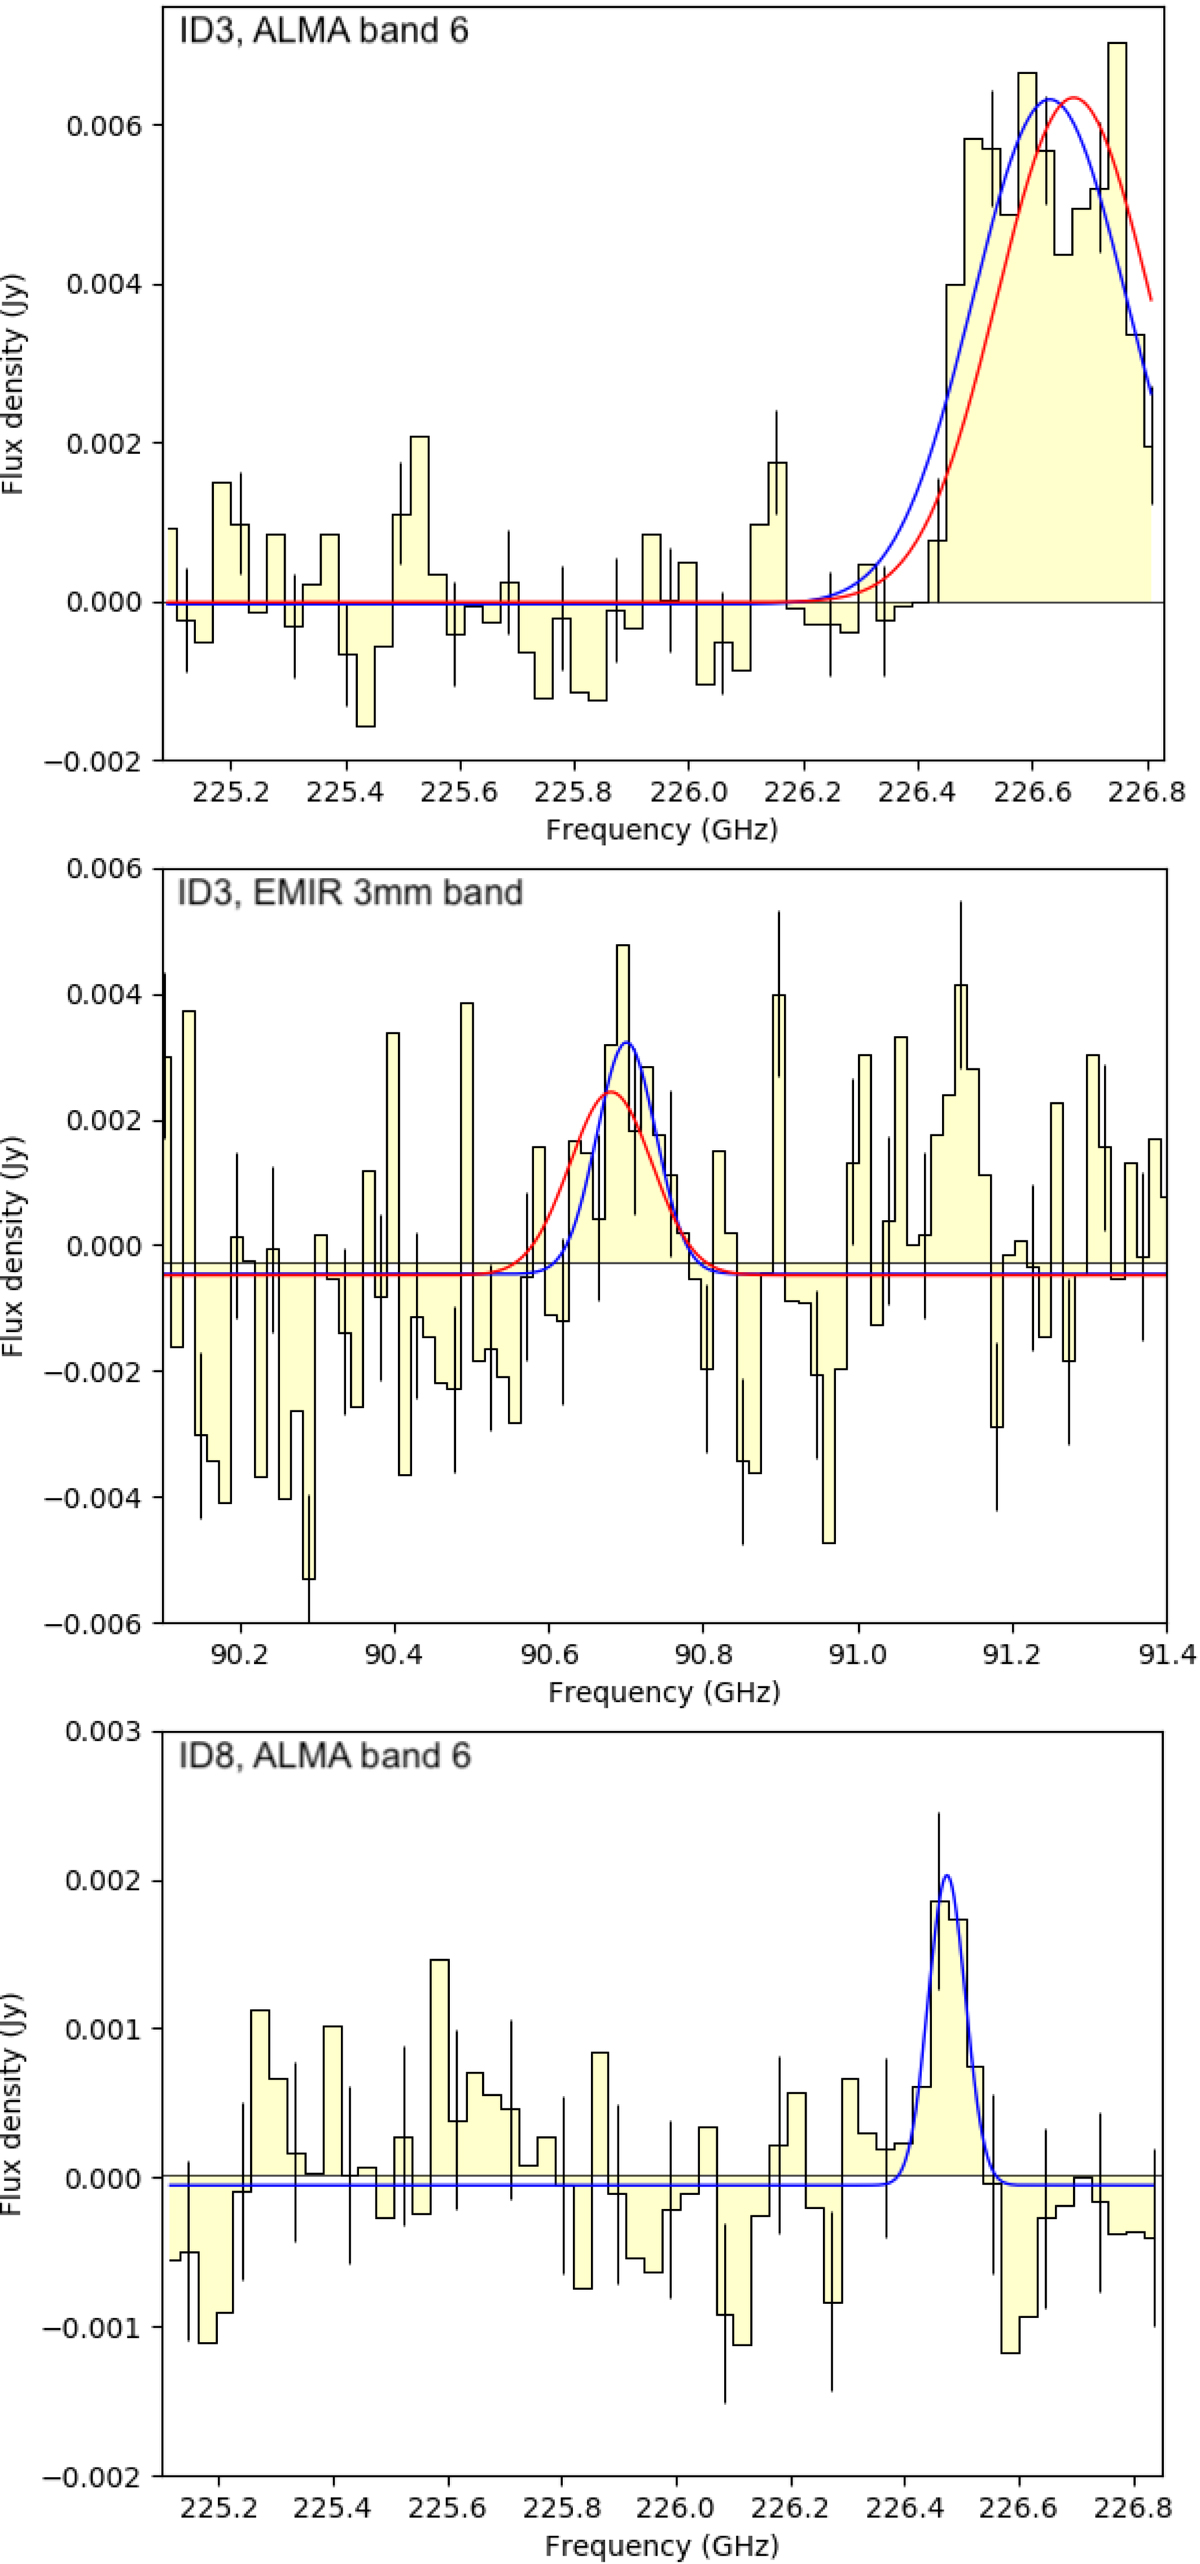
Fig. 9.

Spectra of the two ALMA galaxies ID 3 (top and middle) and ID 8 (bottom), showing the serendipitous line detections, consistent with a CO(5–4) transition at z = 1.54. The blue Gaussian profiles show the best fits to each individual line. The red Gaussian profiles for ID 3 show the best combined fit to the CO(5–4) line in the ALMA spectrum (top) and the CO(2–1) line in the IRAM/EMIR spectrum (middle). The offset between the fitted line centres seen in the EMIR data is small, 66 km s−1, and could be due to the low S/N, the edge of the ALMA spectral window, or a physical difference between the transitions. Representative error bars per bin are shown for every third bin. We note that we have applied the standard flagging of edge channels in the ALMA spectral window for ID 3, which otherwise could introduce systematic uncertainties.
Current usage metrics show cumulative count of Article Views (full-text article views including HTML views, PDF and ePub downloads, according to the available data) and Abstracts Views on Vision4Press platform.
Data correspond to usage on the plateform after 2015. The current usage metrics is available 48-96 hours after online publication and is updated daily on week days.
Initial download of the metrics may take a while.


