Free Access
Fig. 8.
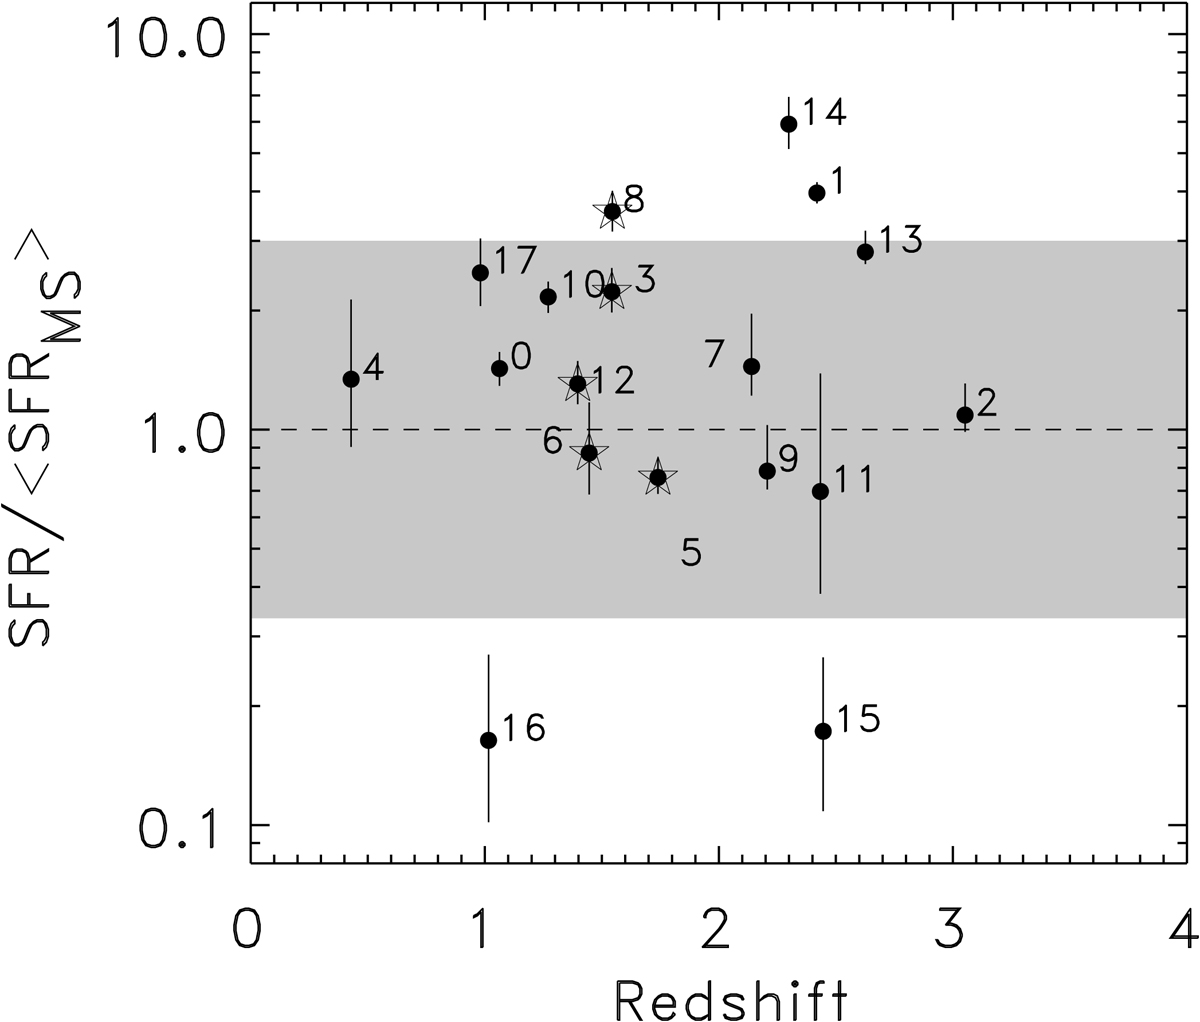
“Starburstiness”, which is the ratio of the star-formation rate to the SFR expected for a source on the MS (using the relation at the respective redshift), plotted against redshift. A factor of 3 around the MS is indicated by the grey region. Stars highlight galaxies assumed to be at z ≃ 1.54.
Current usage metrics show cumulative count of Article Views (full-text article views including HTML views, PDF and ePub downloads, according to the available data) and Abstracts Views on Vision4Press platform.
Data correspond to usage on the plateform after 2015. The current usage metrics is available 48-96 hours after online publication and is updated daily on week days.
Initial download of the metrics may take a while.