Fig. 7.
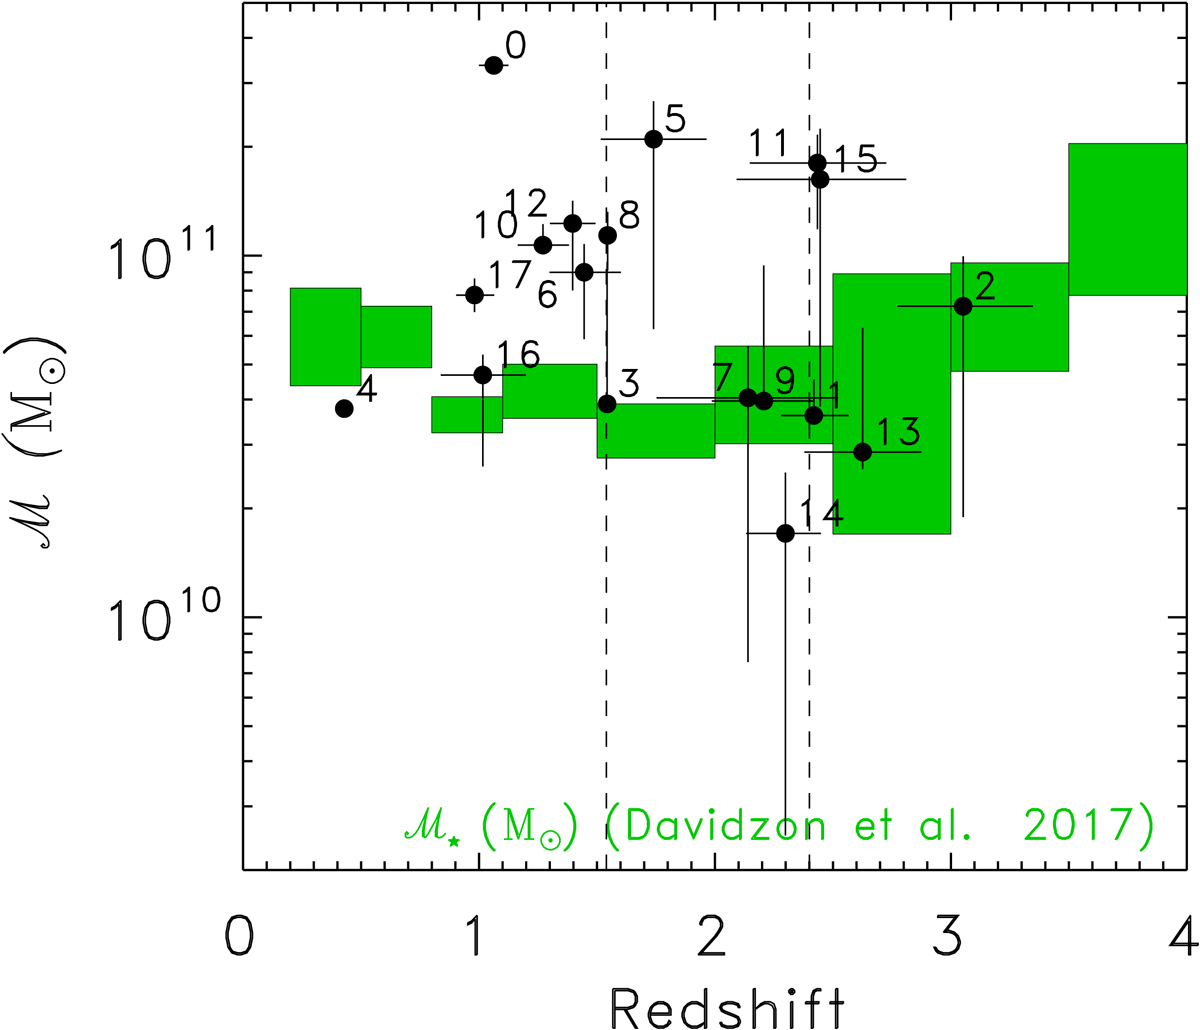
Stellar mass as a function of photometric redshift for the 18 ALMA galaxies. The green rectangles represent the expected values of the characteristic mass ℳ* and their uncertainties obtained by fitting the mass function of SFGs with a Schechter function in the redshift ranges 0.2–0.5, 0.5–0.8, 0.8–1.1, 1.1–1.5, 1.5–2.0, 2.0–2.5, 2.5–3.0, 3.0–3.5, and 3.5–4.0 (Davidzon et al. 2017). The source IDs are labelled next to the corresponding symbols.
Current usage metrics show cumulative count of Article Views (full-text article views including HTML views, PDF and ePub downloads, according to the available data) and Abstracts Views on Vision4Press platform.
Data correspond to usage on the plateform after 2015. The current usage metrics is available 48-96 hours after online publication and is updated daily on week days.
Initial download of the metrics may take a while.