Fig. 5.
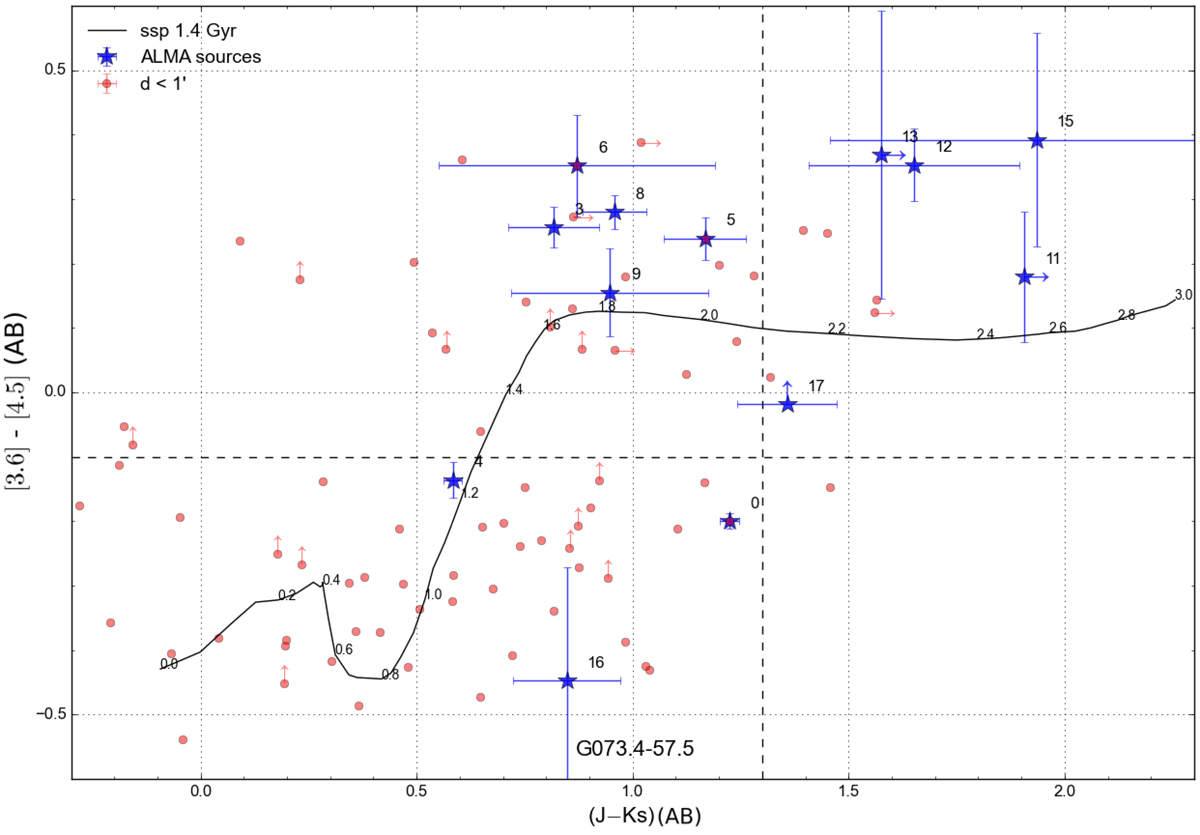
Spitzer-IRAC versus CFHT WIRCam colour-colour diagram, with a track drawn from Bruzual & Charlot (2003) for a 1.4 Gyr simple stellar population, numbered by redshift. The horizontal and vertical dashed lines indicate the Papovich (2008) and Franx et al. (2003) criteria, respectively, representing colours of z ≃ 1.3 and z ≃ 2 galaxies (cf. the labels on the model curve). A redshift around z = 1.6–2.6 is indicated for the majority of the ALMA galaxies. Arrows represent 2σ limits for the sources not detected in any channel or band.
Current usage metrics show cumulative count of Article Views (full-text article views including HTML views, PDF and ePub downloads, according to the available data) and Abstracts Views on Vision4Press platform.
Data correspond to usage on the plateform after 2015. The current usage metrics is available 48-96 hours after online publication and is updated daily on week days.
Initial download of the metrics may take a while.