Fig. 4.
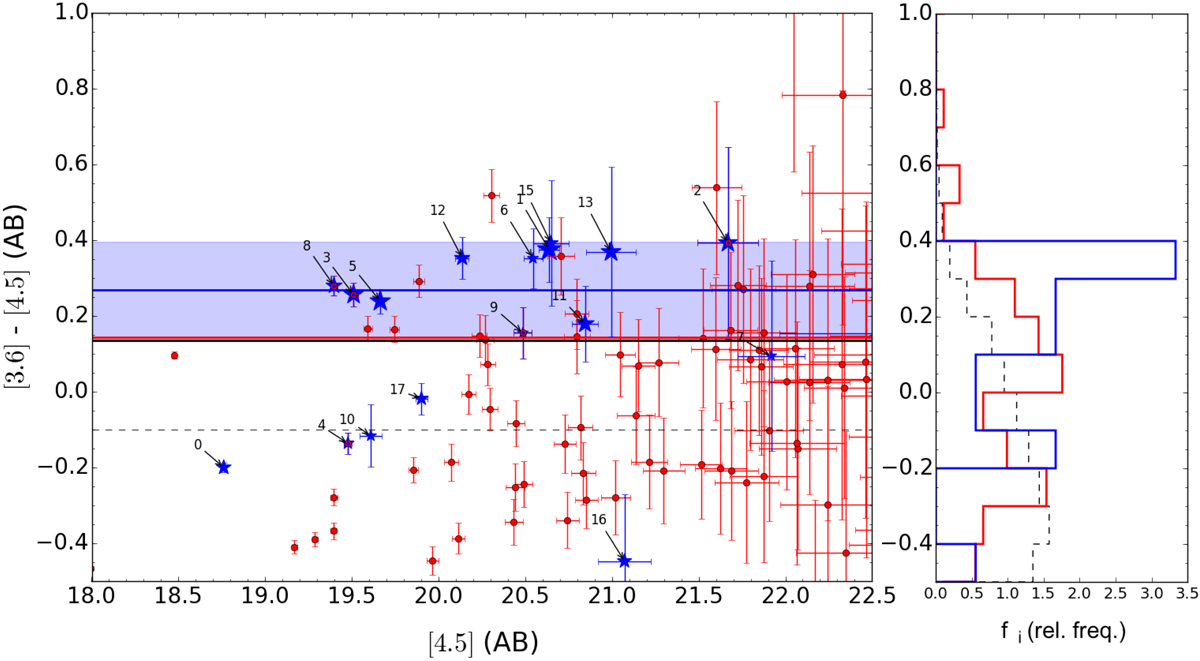
Left: colour ([3.6] − [4.5]) versus magnitude ([4.5]) diagram for IRAC sources (red points) located within 1′ of SPIRE source 11, and for all the ALMA sources (blue stars); “[3.6]” means “channel 1” and “[4.5]” is “channel 2”. Numbers indicate the ALMA source IDs, as in Table 1. The black dashed line indicates a colour of −0.1 (red sources are defined to have colours above this value), the red line indicates the median colour of IRAC red sources within 1′ of SPIRE source 11 (0.14 mag), and the blue line indicates the median colour for the ALMA sources matched to IRAC red sources (0.27 mag). The dispersions around these median values are 0.15 and 0.13 mag, respectively (the latter is indicated by the blue region). The solid black line indicates the colour of a single stellar population formed at zf = 5, passively evolved to redshift z = 1.5 (from Bruzual & Charlot 2003), but extinction and possible metallicity effects have not been considered. Most ALMA sources lie on a sequence in this colour-magnitude plane, a characteristic feature of high-z structures (e.g. Muzzin et al. 2013; Rettura et al. 2014). We note that ALMA ID 14 is not plotted here, because it was not detected in the Spitzer-IRAC data. Right: normalised distribution of the colour of IRAC sources: the red line corresponds to sources within 1′ of SPIRE source 11; the blue line shows the ALMA sources; and the black dashed line shows the distribution of the colours of general sources in the COSMOS field for comparison. There is a significant excess of red galaxies around SPIRE source 11, in particular for the ALMA detections (further details in the text).
Current usage metrics show cumulative count of Article Views (full-text article views including HTML views, PDF and ePub downloads, according to the available data) and Abstracts Views on Vision4Press platform.
Data correspond to usage on the plateform after 2015. The current usage metrics is available 48-96 hours after online publication and is updated daily on week days.
Initial download of the metrics may take a while.