Fig. 2.
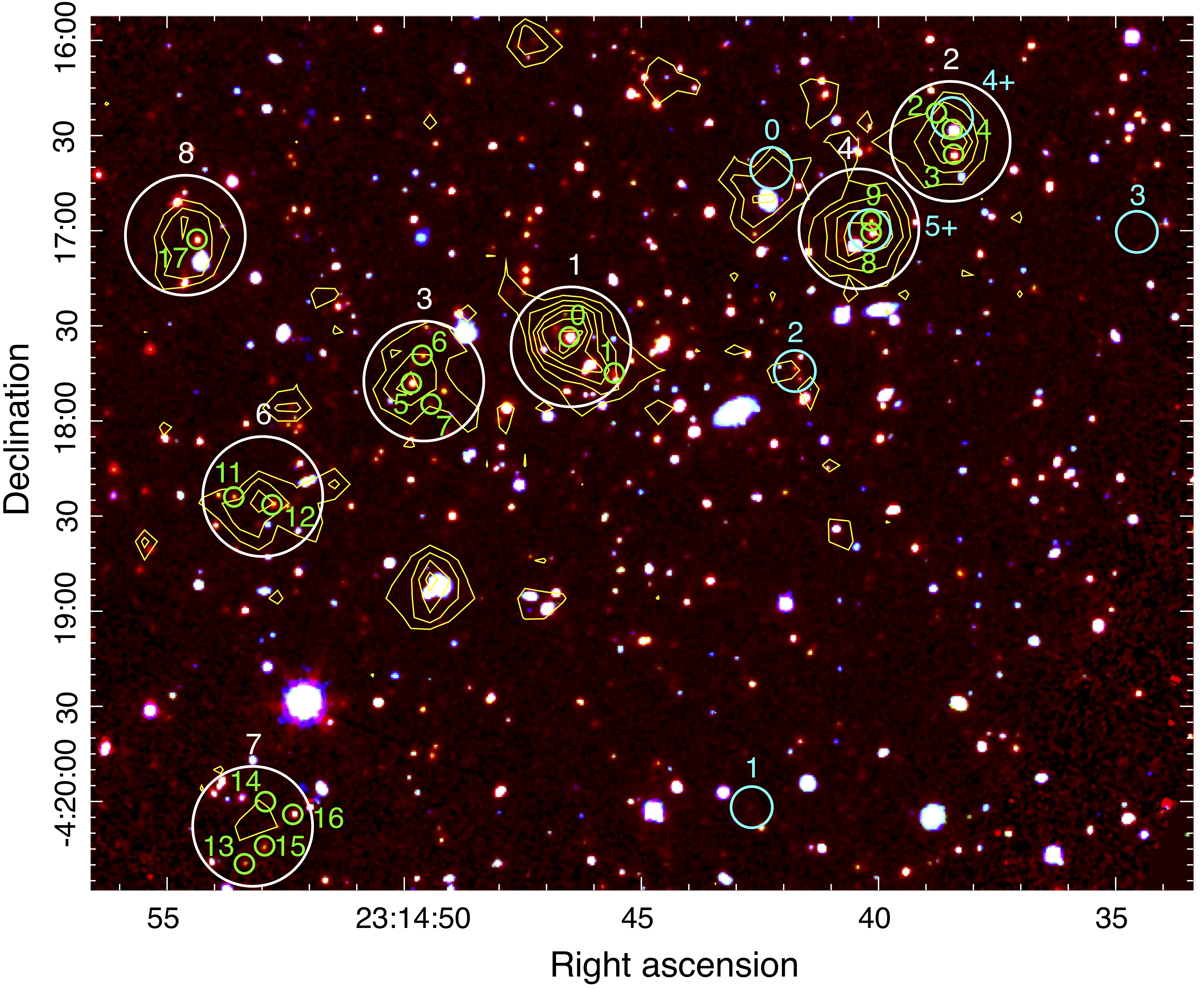
Central region (5.8′ × 4.6′) of G073.4−57.5 in a 3-colour image of Spitzer-IRAC 3.6 μm (red), combined CFHT-WIRCam/VLT-HAWKI K-band (green) and J-band (blue), with Herschel-SPIRE 250 μm contours in yellow (from 0.02 Jy beam−1 in 0.0125 Jy beam−1 steps) and ALMA galaxy positions shown with green circles of radius 3″ (enlarged by a factor of 12 from ALMA’s synthesised beam for clarity), labelled according to their source IDs given in Table 2. The ALMA areas that were used for the analysis (0.2 times the primary-beam peak response) are indicated with white circles (37″ diameter), labelled according to their field IDs given in Table 2. Four SCUBA-2 sources centred in the cyan circles (13″ diameter, matching the beam size) are labelled according to MacKenzie et al. (2017); the two SCUBA-2 sources labelled “4+/5+” are additionally selected as > 3σ peaks in the SCUBA-2 maps coincident with ALMA-detected sources. ALMA field 5 (with one detected source, see Fig. 3) is located above and to the right of the central region and is not shown in this image.
Current usage metrics show cumulative count of Article Views (full-text article views including HTML views, PDF and ePub downloads, according to the available data) and Abstracts Views on Vision4Press platform.
Data correspond to usage on the plateform after 2015. The current usage metrics is available 48-96 hours after online publication and is updated daily on week days.
Initial download of the metrics may take a while.