Fig. 15.
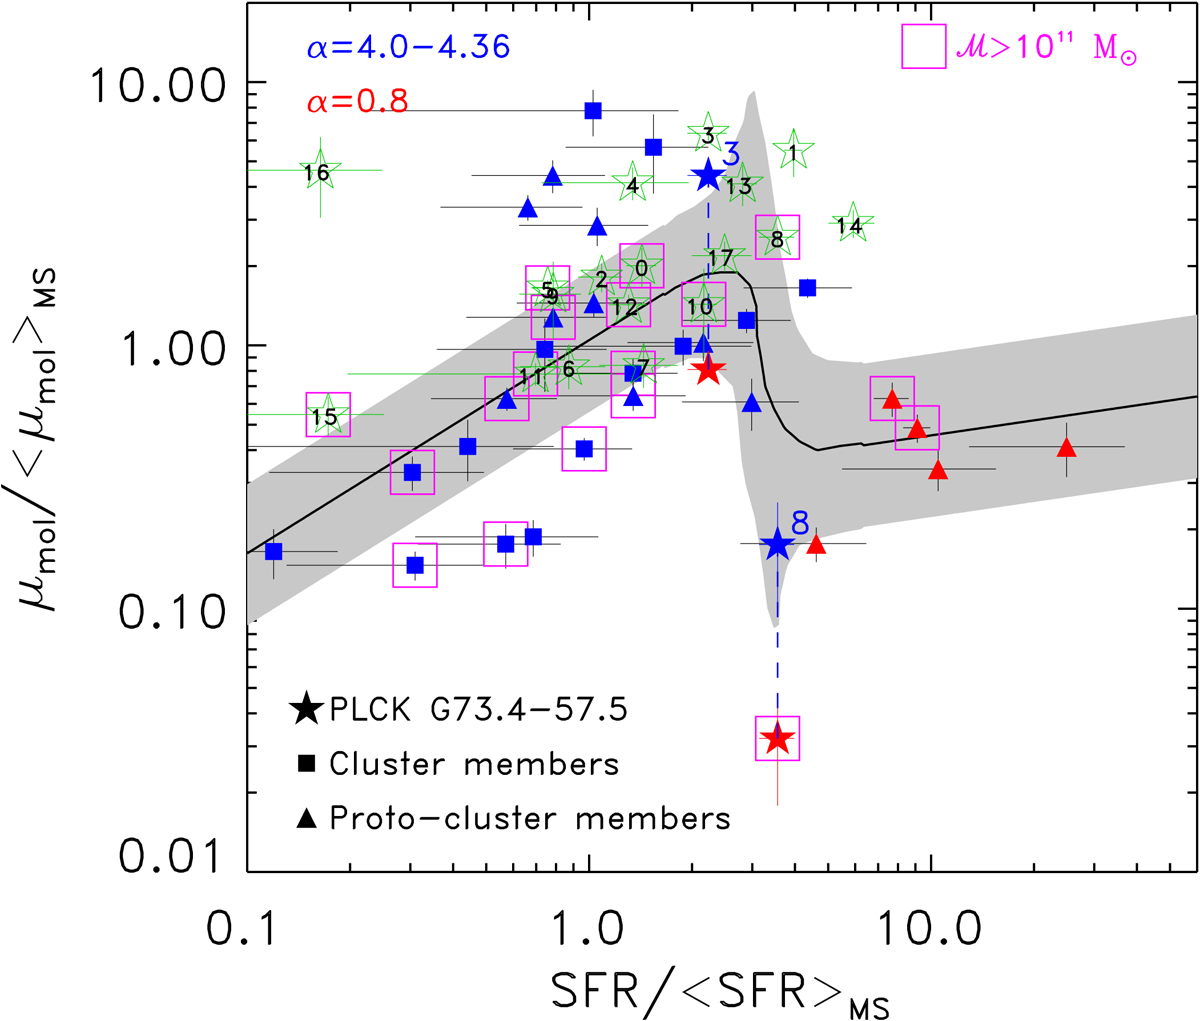
Normalised molecular gas mass fraction μmol ≡ Mgas/ℳ as a function of the normalised SFR. The symbols are defined as in Fig. 13. The black solid curve and grey area represent the values predicted by the 2-SFM framework described in Sargent et al. (2014). Sources with ℳ > 1011 M⊙ are shown with magenta large squares. The grey area shows the expected 1σ scatter around the average molecular gas mass fraction.
Current usage metrics show cumulative count of Article Views (full-text article views including HTML views, PDF and ePub downloads, according to the available data) and Abstracts Views on Vision4Press platform.
Data correspond to usage on the plateform after 2015. The current usage metrics is available 48-96 hours after online publication and is updated daily on week days.
Initial download of the metrics may take a while.