Fig. 10.
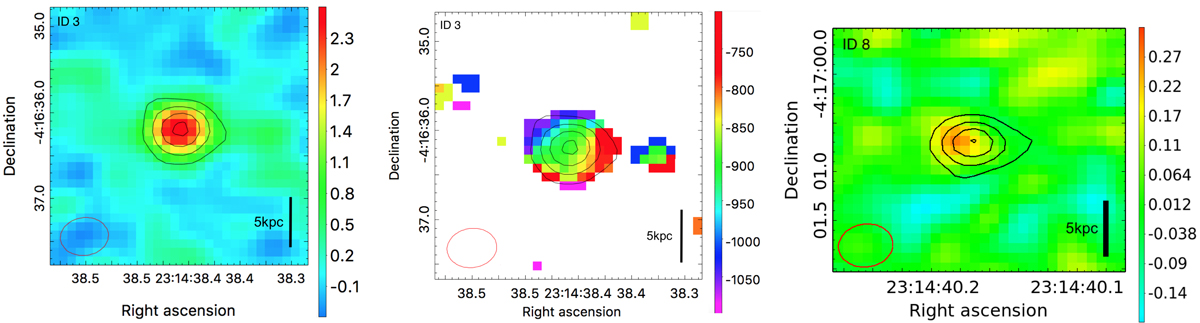
Images for ID 3 (on the left) and ID 8 (on the right) of the integrated line emission in Jy km s−1 beam−1 (where the continuum has been subtracted). In both cases line and continuum emission (i.e. the black contours from 3σ = 0.18 mJy in 3σ steps) coincide. The middle panel shows (for the stronger line of ID 3 only) the first-moment image in km s−1, along with continuum contours for reference. The FWHM of the synthesised beam (0.56″ × 0.44″) is shown with red ellipses and a 5 kpc bar is shown in black for reference.
Current usage metrics show cumulative count of Article Views (full-text article views including HTML views, PDF and ePub downloads, according to the available data) and Abstracts Views on Vision4Press platform.
Data correspond to usage on the plateform after 2015. The current usage metrics is available 48-96 hours after online publication and is updated daily on week days.
Initial download of the metrics may take a while.