Fig. 1.
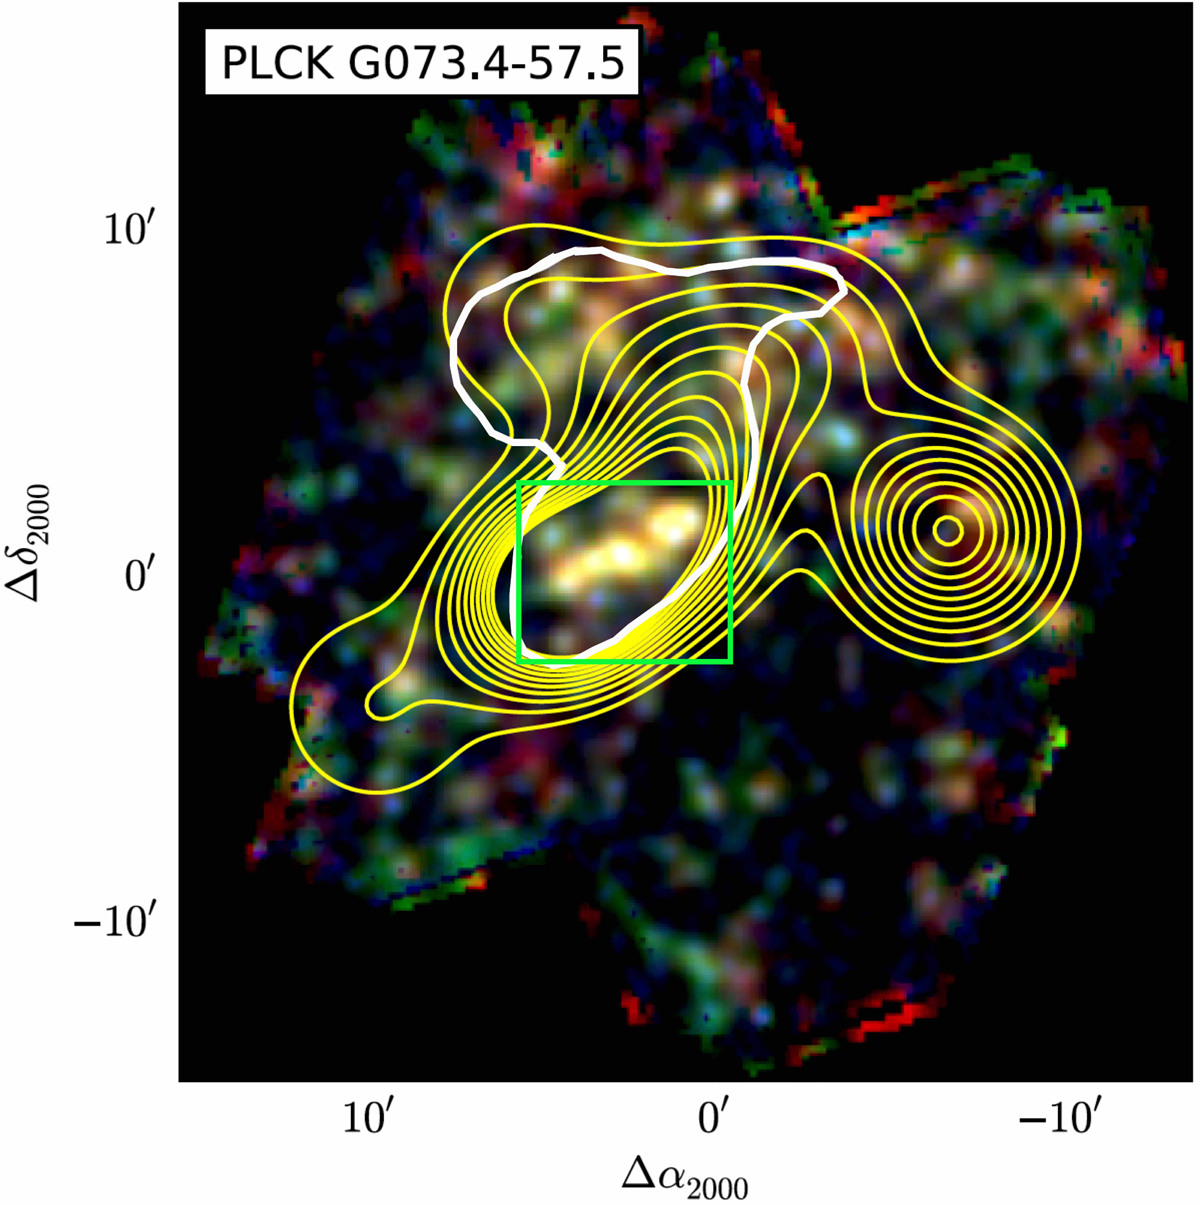
Three-colour SPIRE image for G073.4−57.5 (reproduced from Planck Collaboration Int. XXVII 2015): blue, 250 μm; green, 350 μm; and red, 500 μm. The white contour shows the region encompassing 50% of the Planck flux density, while the yellow contours are the significance of the overdensity of red (350 μm) sources, plotted starting at 2σ with 1σ incremental steps. The rectangular area covering the ALMA pointings shown in Fig. 2 is highlighted in green.
Current usage metrics show cumulative count of Article Views (full-text article views including HTML views, PDF and ePub downloads, according to the available data) and Abstracts Views on Vision4Press platform.
Data correspond to usage on the plateform after 2015. The current usage metrics is available 48-96 hours after online publication and is updated daily on week days.
Initial download of the metrics may take a while.