Fig. 4.
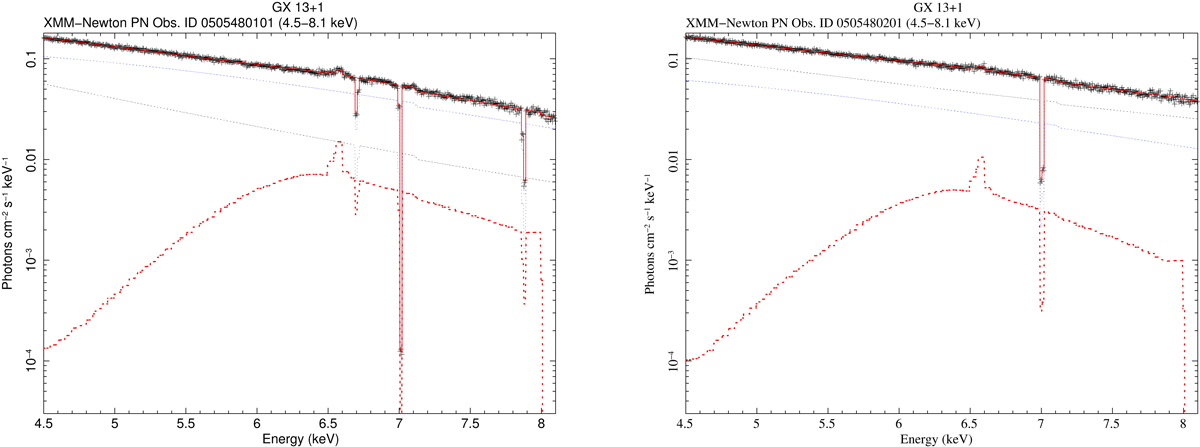
GX13+1 XMM-Newton EPIC pn spectra. Left panel: unfolded spectrum of Obs. 1 in the 4.5–8.1 keV energy range, the data (in black), the total model TBABS*(BBODYRAD+COMPTT+WINDLINE(6.6 KEV))*LGABS*LGABS*LGABS (solid red line), the red-skewed emission line at 6.6 keV (dashed red line), and the continuum components (dashed black and blue lines). The three absorbed Gaussian lines correspond to the narrow He- and H-like Kα and the He-like Kβ Fe absorption lines. Right panel: unfolded spectrum of Obs. 2 in the 4.5–8.1 keV energy range, the data (in black), the total model TBABS*(BBODYRAD+COMPTT+WINDLINE(6.6 KEV))*LGABS (solid red line), the red-skewed emission line at 6.6 keV (dashed red line), and the continuum component (dashed black and blue lines). The absorbed Gaussian line corresponds to the narrow H-like Kα Fe absorption line at 7.0 keV.
Current usage metrics show cumulative count of Article Views (full-text article views including HTML views, PDF and ePub downloads, according to the available data) and Abstracts Views on Vision4Press platform.
Data correspond to usage on the plateform after 2015. The current usage metrics is available 48-96 hours after online publication and is updated daily on week days.
Initial download of the metrics may take a while.