Fig. 3.
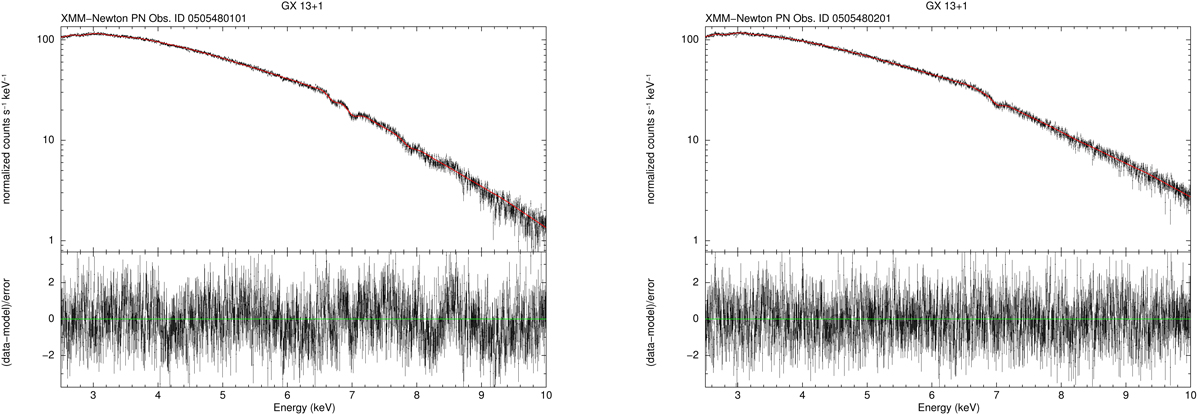
GX13+1 XMM-Newton EPIC pn spectra. Left panel: spectrum of Obs. 1 in the 2.5–10 keV energy range, the data (in black), and the total model TBABS*(BBODYRAD+COMPTT+WINDLINE(6.6 KEV))*LGABS*LGABS*LGABS (solid red line). Right panel: spectrum of Obs. 2 in the 2.5–10 keV energy range, the data (in black), and the best-fit model TBABS*(BBODYRAD+COMPTT+WINDLINE(6.6 KEV))*LGABS (solid red line). The lower panels, in the left and right figures, show the residuals of the data vs. model.
Current usage metrics show cumulative count of Article Views (full-text article views including HTML views, PDF and ePub downloads, according to the available data) and Abstracts Views on Vision4Press platform.
Data correspond to usage on the plateform after 2015. The current usage metrics is available 48-96 hours after online publication and is updated daily on week days.
Initial download of the metrics may take a while.