Open Access
Fig. 17.
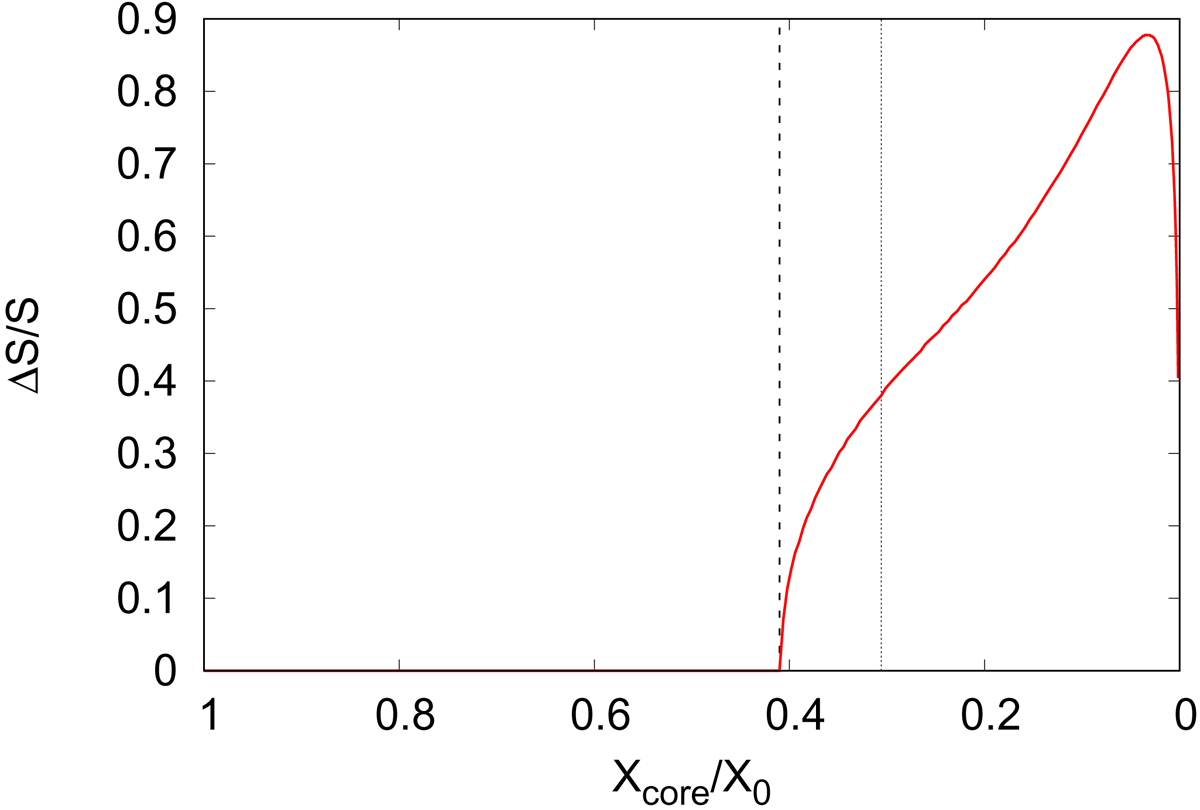
Evolution of the surface fraction of the star where the effective temperature is lower than ![]() , for a 15 M⊙ star with Z = 0.02 and for ωi = 0.5. The black dashed line marks the evolutionary time at which the star reaches a TWR. The black dotted line marks the threshold between Phase 1 and 2.
, for a 15 M⊙ star with Z = 0.02 and for ωi = 0.5. The black dashed line marks the evolutionary time at which the star reaches a TWR. The black dotted line marks the threshold between Phase 1 and 2.
Current usage metrics show cumulative count of Article Views (full-text article views including HTML views, PDF and ePub downloads, according to the available data) and Abstracts Views on Vision4Press platform.
Data correspond to usage on the plateform after 2015. The current usage metrics is available 48-96 hours after online publication and is updated daily on week days.
Initial download of the metrics may take a while.