Fig. 16.
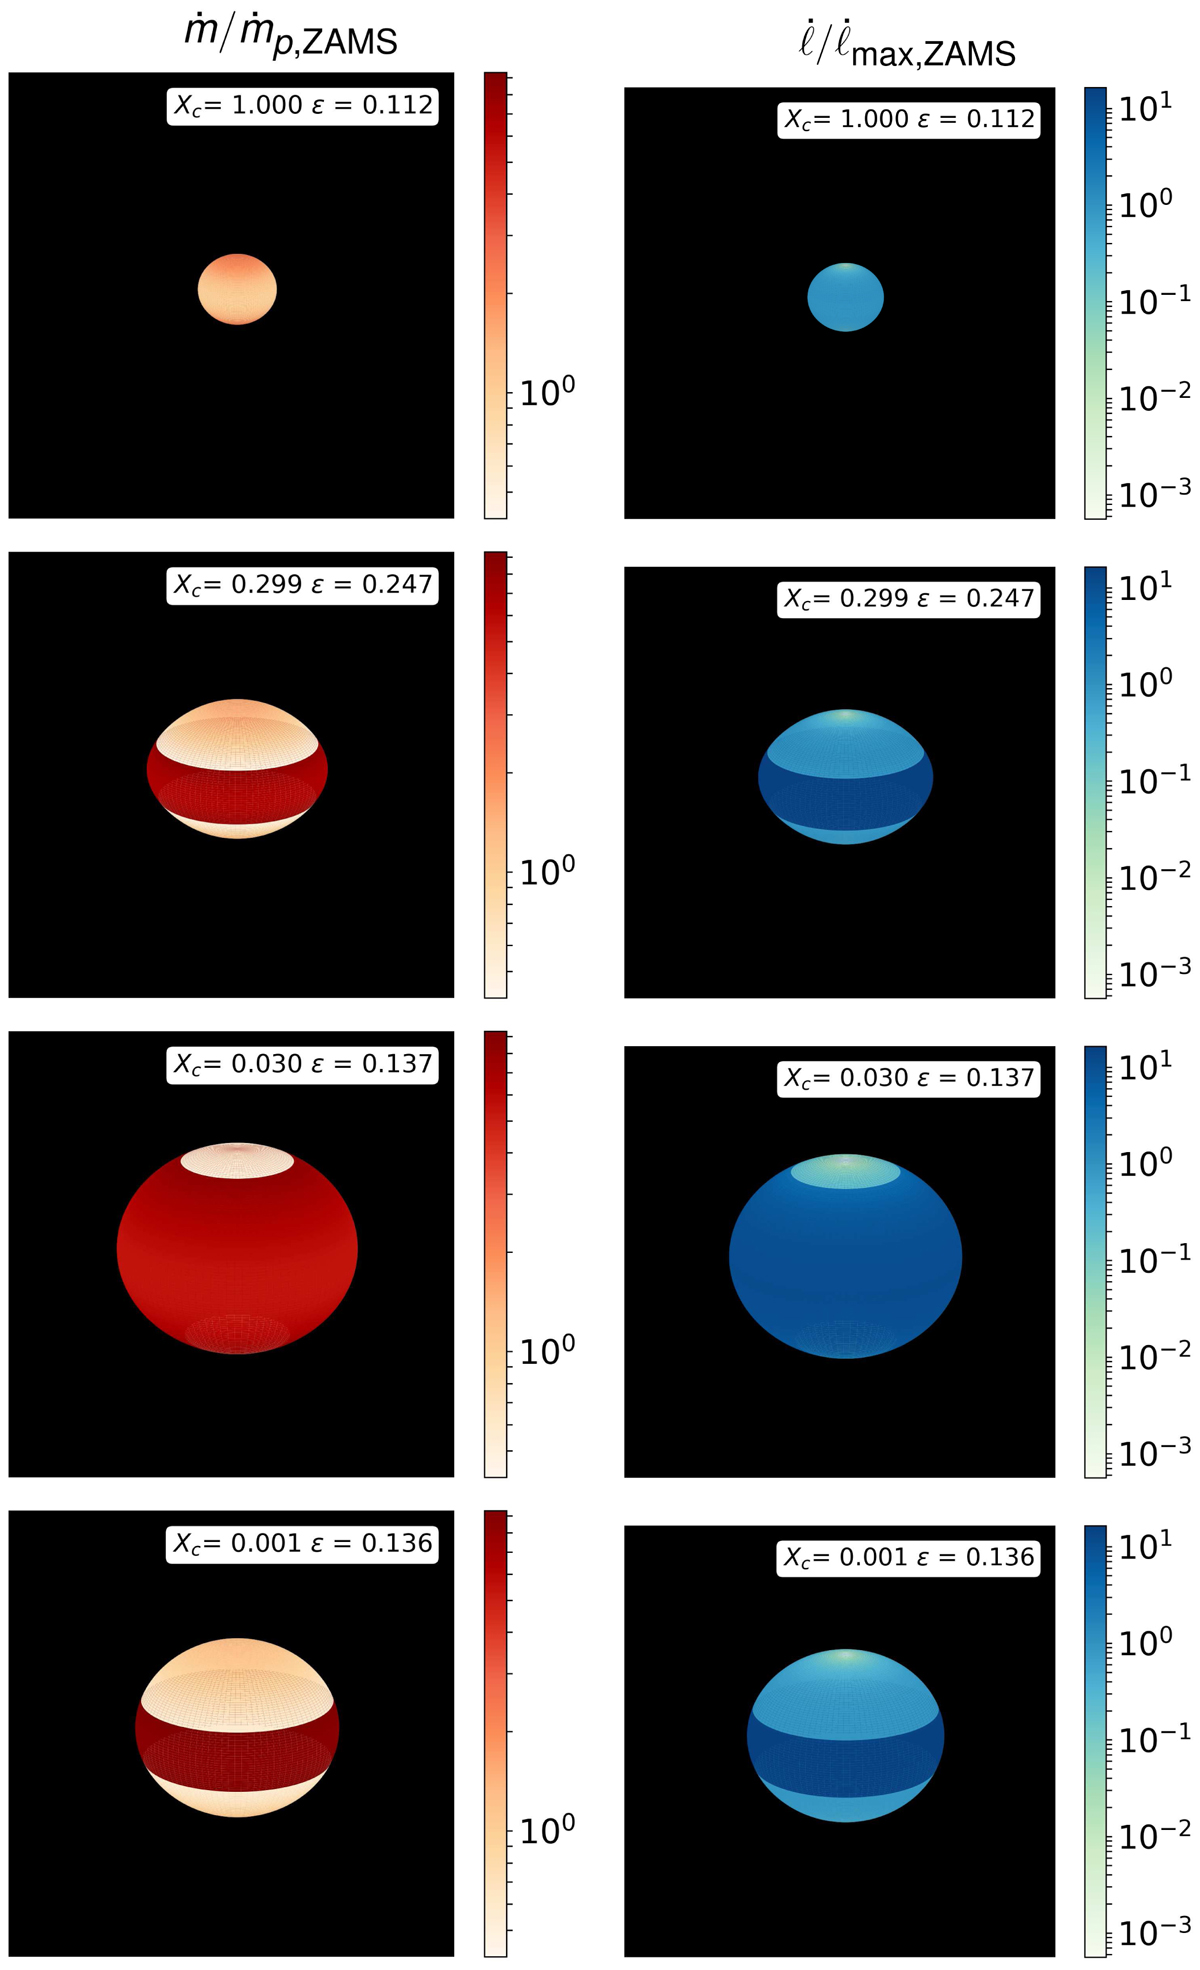
Snapshots of the local mass-flux ṁ in units of the polar mass-flux at ZAMS ṁp,ZAMS (left) and of the local angular momentum flux ![]() in units of the maximum angular momentum flux at ZAMS
in units of the maximum angular momentum flux at ZAMS ![]() (right) for a 15 M⊙ ESTER 2D-model with Z = 0.02 and for ωi = 0.5, at four different time steps: Xc ≃ 1, 0.3, 0.03 and 0. The first one corresponds to ZAMS, the second corresponds to the end of Phase 1, the third is the end of Phase 2, and the last snapshot corresponds to the very end of the MS evolution. The star is viewed with an inclination i = 70°.
(right) for a 15 M⊙ ESTER 2D-model with Z = 0.02 and for ωi = 0.5, at four different time steps: Xc ≃ 1, 0.3, 0.03 and 0. The first one corresponds to ZAMS, the second corresponds to the end of Phase 1, the third is the end of Phase 2, and the last snapshot corresponds to the very end of the MS evolution. The star is viewed with an inclination i = 70°.
Current usage metrics show cumulative count of Article Views (full-text article views including HTML views, PDF and ePub downloads, according to the available data) and Abstracts Views on Vision4Press platform.
Data correspond to usage on the plateform after 2015. The current usage metrics is available 48-96 hours after online publication and is updated daily on week days.
Initial download of the metrics may take a while.