Fig. 15.
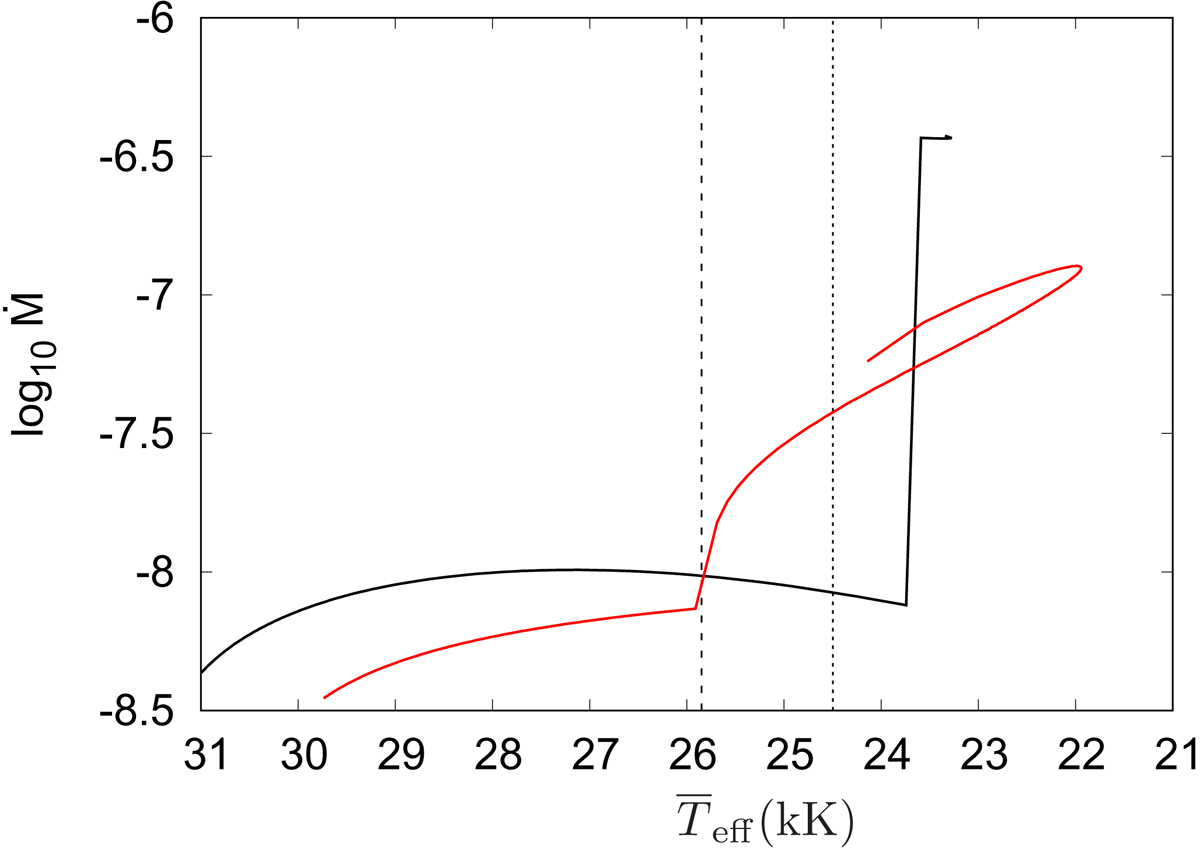
Evolution of the mass-loss rate Ṁ as a function of the mean effective temperature ![]() for a 15 M⊙ ESTER 2D-model with Z = 0.02 and for ωi = 0.5. The star evolves from left to right with a mean effective temperature approaching 30 kK at ZAMS, and
for a 15 M⊙ ESTER 2D-model with Z = 0.02 and for ωi = 0.5. The star evolves from left to right with a mean effective temperature approaching 30 kK at ZAMS, and ![]() kK at TAMS. The black curve corresponds to case of a non-rotating 15 M⊙ star with Z = 0.02 for which the mass-loss rate has been calculated using Vink et al. (2001) prescription. The vertical dashed line marks the evolutionary time at which the star reaches a TWR. The vertical dotted line marks the transition between Phase 1 and 2.
kK at TAMS. The black curve corresponds to case of a non-rotating 15 M⊙ star with Z = 0.02 for which the mass-loss rate has been calculated using Vink et al. (2001) prescription. The vertical dashed line marks the evolutionary time at which the star reaches a TWR. The vertical dotted line marks the transition between Phase 1 and 2.
Current usage metrics show cumulative count of Article Views (full-text article views including HTML views, PDF and ePub downloads, according to the available data) and Abstracts Views on Vision4Press platform.
Data correspond to usage on the plateform after 2015. The current usage metrics is available 48-96 hours after online publication and is updated daily on week days.
Initial download of the metrics may take a while.