Fig. 13.
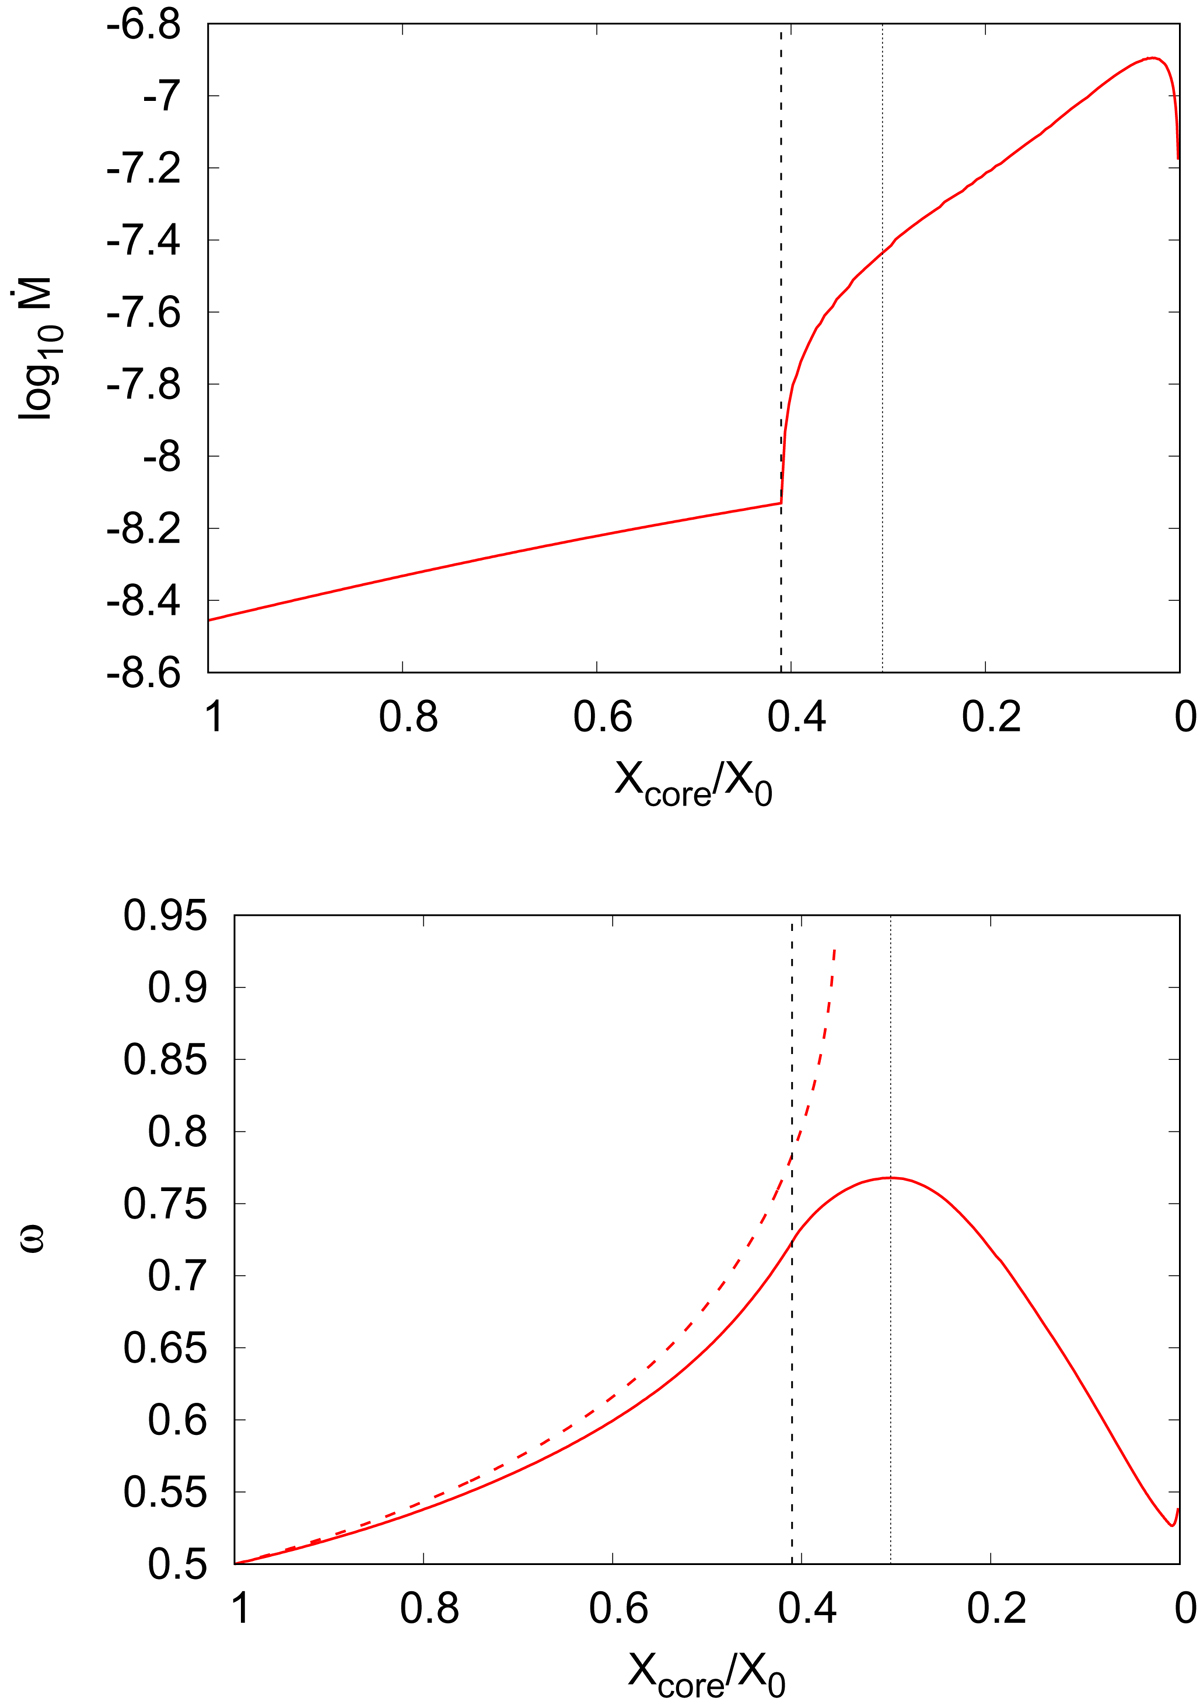
Top: evolution of the mass-loss rate Ṁ (in M⊙ yr−1) as a function of the fractional abundance of hydrogen in the convective core Xcore/X0 for a 15 M⊙ star with Z = 0.02 and for ωi = 0.5. The vertical dashed line marks the evolutionary time at which the star reaches a TWR. The vertical dotted line marks the transition between Phase 1 and 2. Bottom: same but for the angular velocity at equator in units of the equatorial critical angular velocity ω = Ωeq/Ωk. The red dashed line corresponds to the evolution of ω with constant mass and angular momentum throughout the MS.
Current usage metrics show cumulative count of Article Views (full-text article views including HTML views, PDF and ePub downloads, according to the available data) and Abstracts Views on Vision4Press platform.
Data correspond to usage on the plateform after 2015. The current usage metrics is available 48-96 hours after online publication and is updated daily on week days.
Initial download of the metrics may take a while.