Fig. 3.
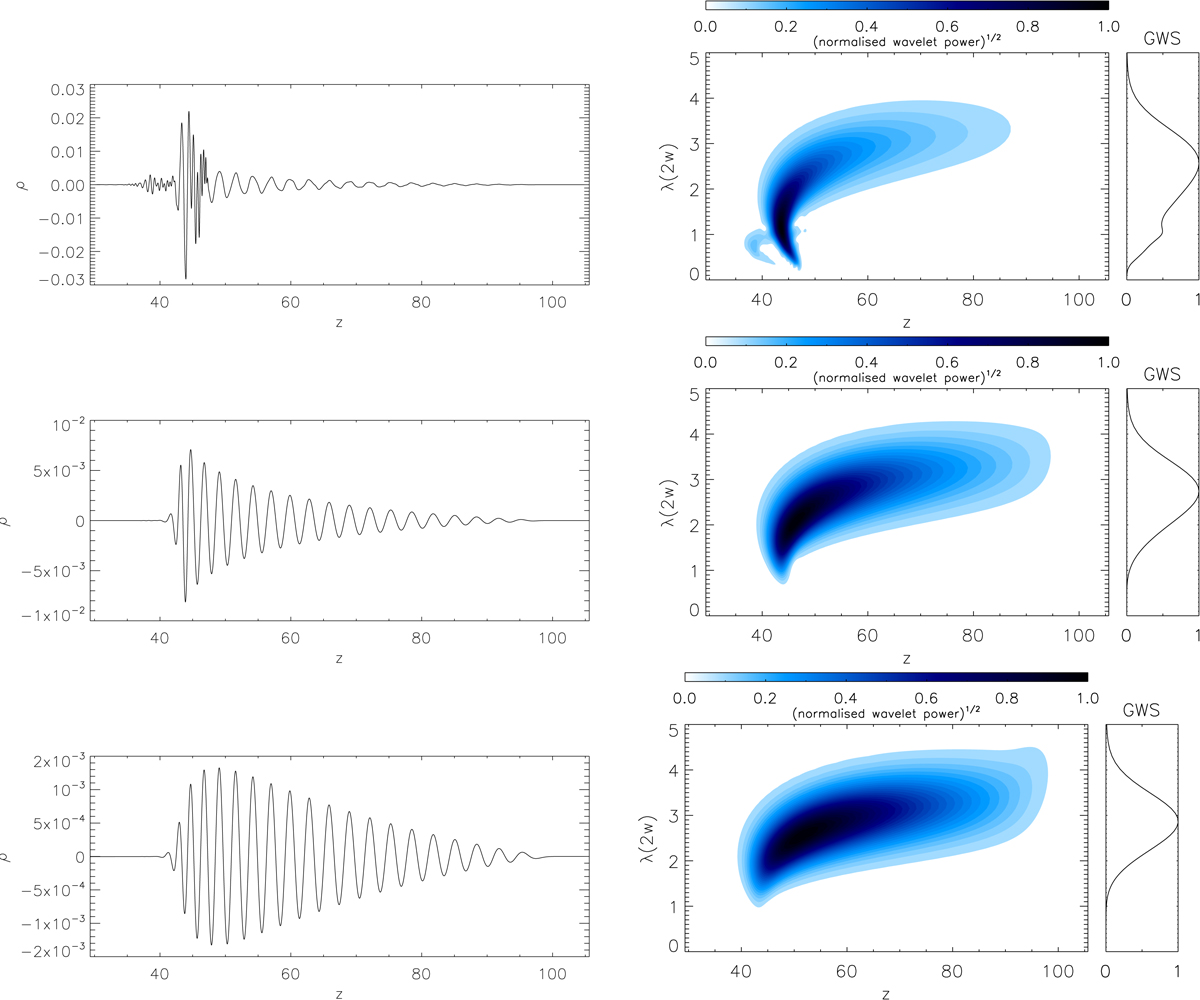
Left panel: pertubation to the equilibrium density measured along the centre of the waveguide (x = 0) at t = 110. Three different driver durations were used, δt = [0.29, 1.12, 1.77]τAi, top to bottom. Right panel: corresponding wavelet spectra plotted as the spectral amplitude and the global wavelet spectrum (GWS) of the normalised spectral amplitude.
Current usage metrics show cumulative count of Article Views (full-text article views including HTML views, PDF and ePub downloads, according to the available data) and Abstracts Views on Vision4Press platform.
Data correspond to usage on the plateform after 2015. The current usage metrics is available 48-96 hours after online publication and is updated daily on week days.
Initial download of the metrics may take a while.