Fig. 1.
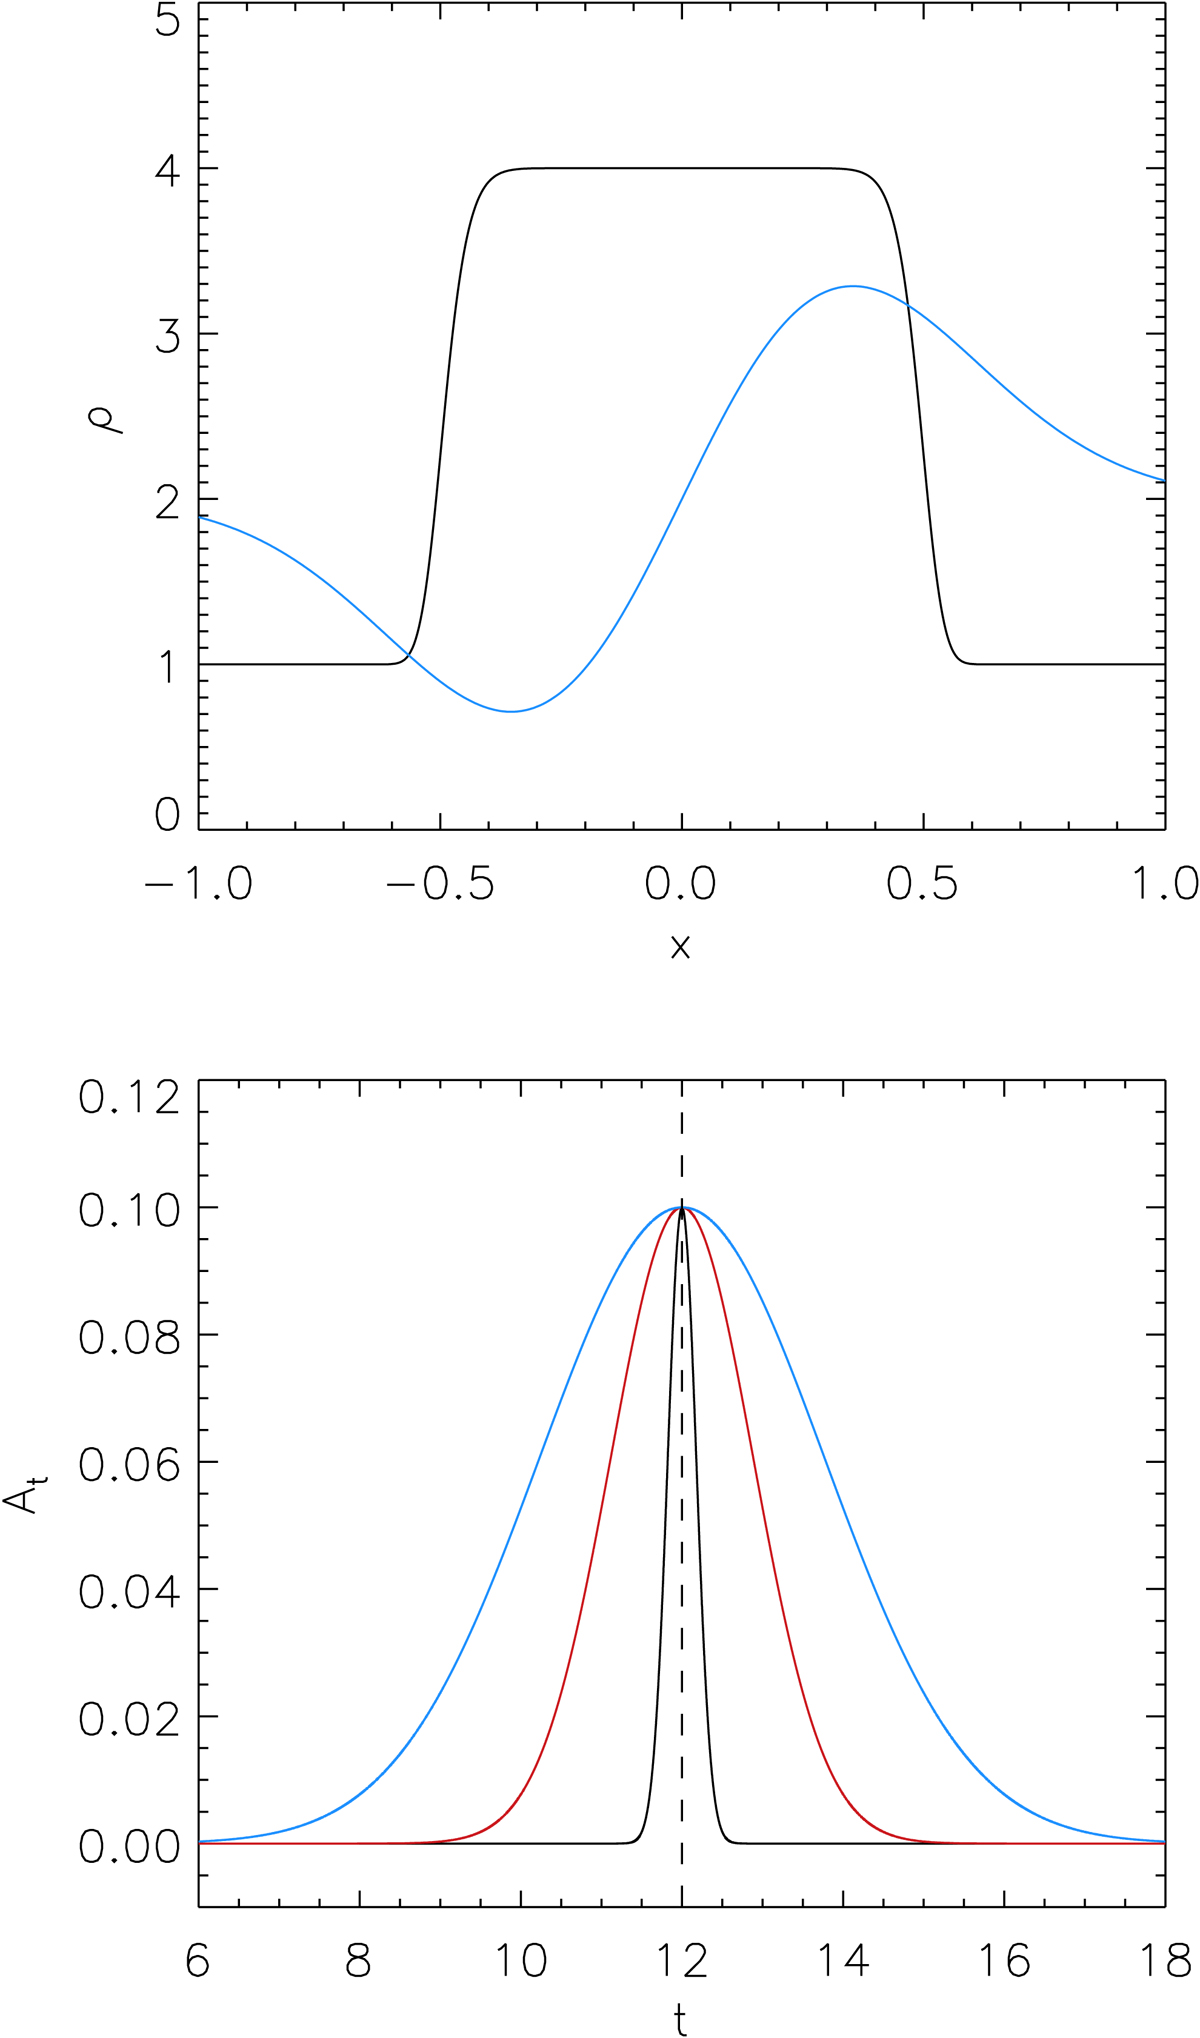
Top panel: transverse density profile of the waveguide. Overplotted in blue is the spatial profile of the vx velocity pulse in arbitrary units. Bottom panel: temporal profile of the driver amplitude for three different driver durations, [0.29, 1.47, 2.94] τAi. The centre of the driving pulse, t0, is indicated by the vertical dashed line.
Current usage metrics show cumulative count of Article Views (full-text article views including HTML views, PDF and ePub downloads, according to the available data) and Abstracts Views on Vision4Press platform.
Data correspond to usage on the plateform after 2015. The current usage metrics is available 48-96 hours after online publication and is updated daily on week days.
Initial download of the metrics may take a while.