Press Release
Free Access
Fig. 1.
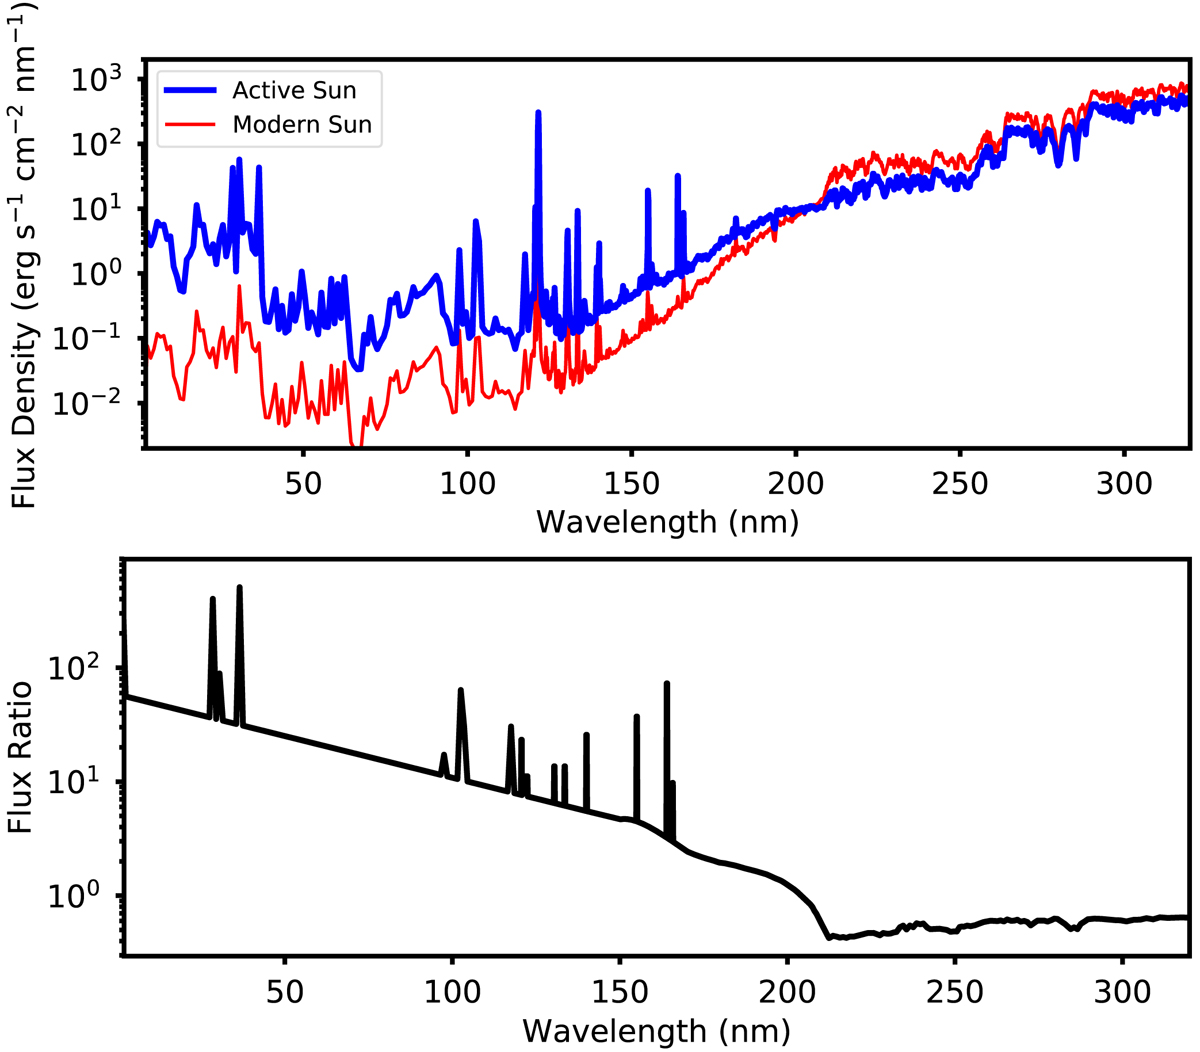
Typical modern solar activity maximum spectrum and the XUV spectrum used in our model as calculated by Claire et al. (2012). The upper panel shows the two spectra and the lower panel shows the ratio of the two.
Current usage metrics show cumulative count of Article Views (full-text article views including HTML views, PDF and ePub downloads, according to the available data) and Abstracts Views on Vision4Press platform.
Data correspond to usage on the plateform after 2015. The current usage metrics is available 48-96 hours after online publication and is updated daily on week days.
Initial download of the metrics may take a while.