Fig. 2.
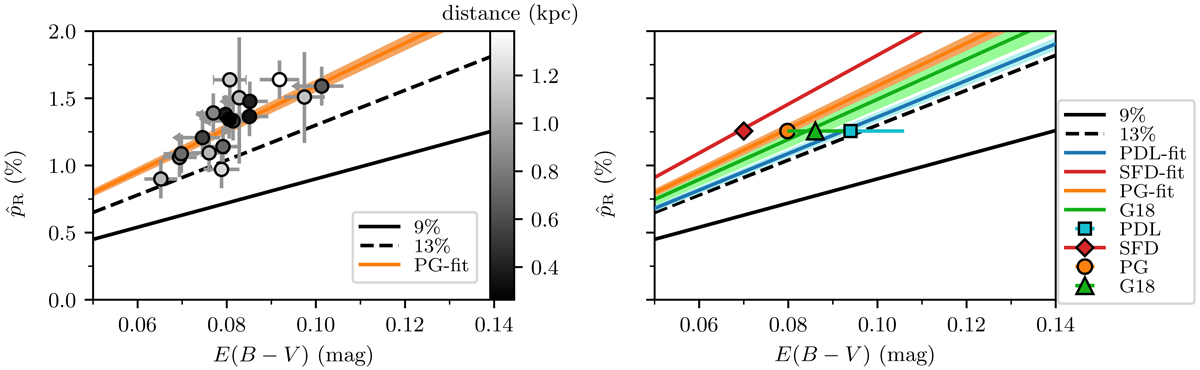
Left: p̂R vs. the PG estimate of E(B − V) for stars farther than 250 pc (circles). Values of [pR/E(B − V)]max equal to 9% and 13% are indicated with black the solid and dashed lines, respectively. The linear fit to the data has a slope of 15.9 ± 0.4% mag−1 (orange line and 1σ uncertainty shown by shaded region). Each star is colored according to its distance (colorbar). Right: effect of uncertainty in E(B − V). A linear fit to the data from each reddening map (PG, orange, SFD, red, PDL, cyan, G18, green) is shown (shaded regions as in left panel). The weighted mean p̂R and E(B − V) is shown for the E(B − V) from PG (orange circle), SFD (red diamond), PDL (cyan square), and G18 (green triangle).
Current usage metrics show cumulative count of Article Views (full-text article views including HTML views, PDF and ePub downloads, according to the available data) and Abstracts Views on Vision4Press platform.
Data correspond to usage on the plateform after 2015. The current usage metrics is available 48-96 hours after online publication and is updated daily on week days.
Initial download of the metrics may take a while.