Fig. 7
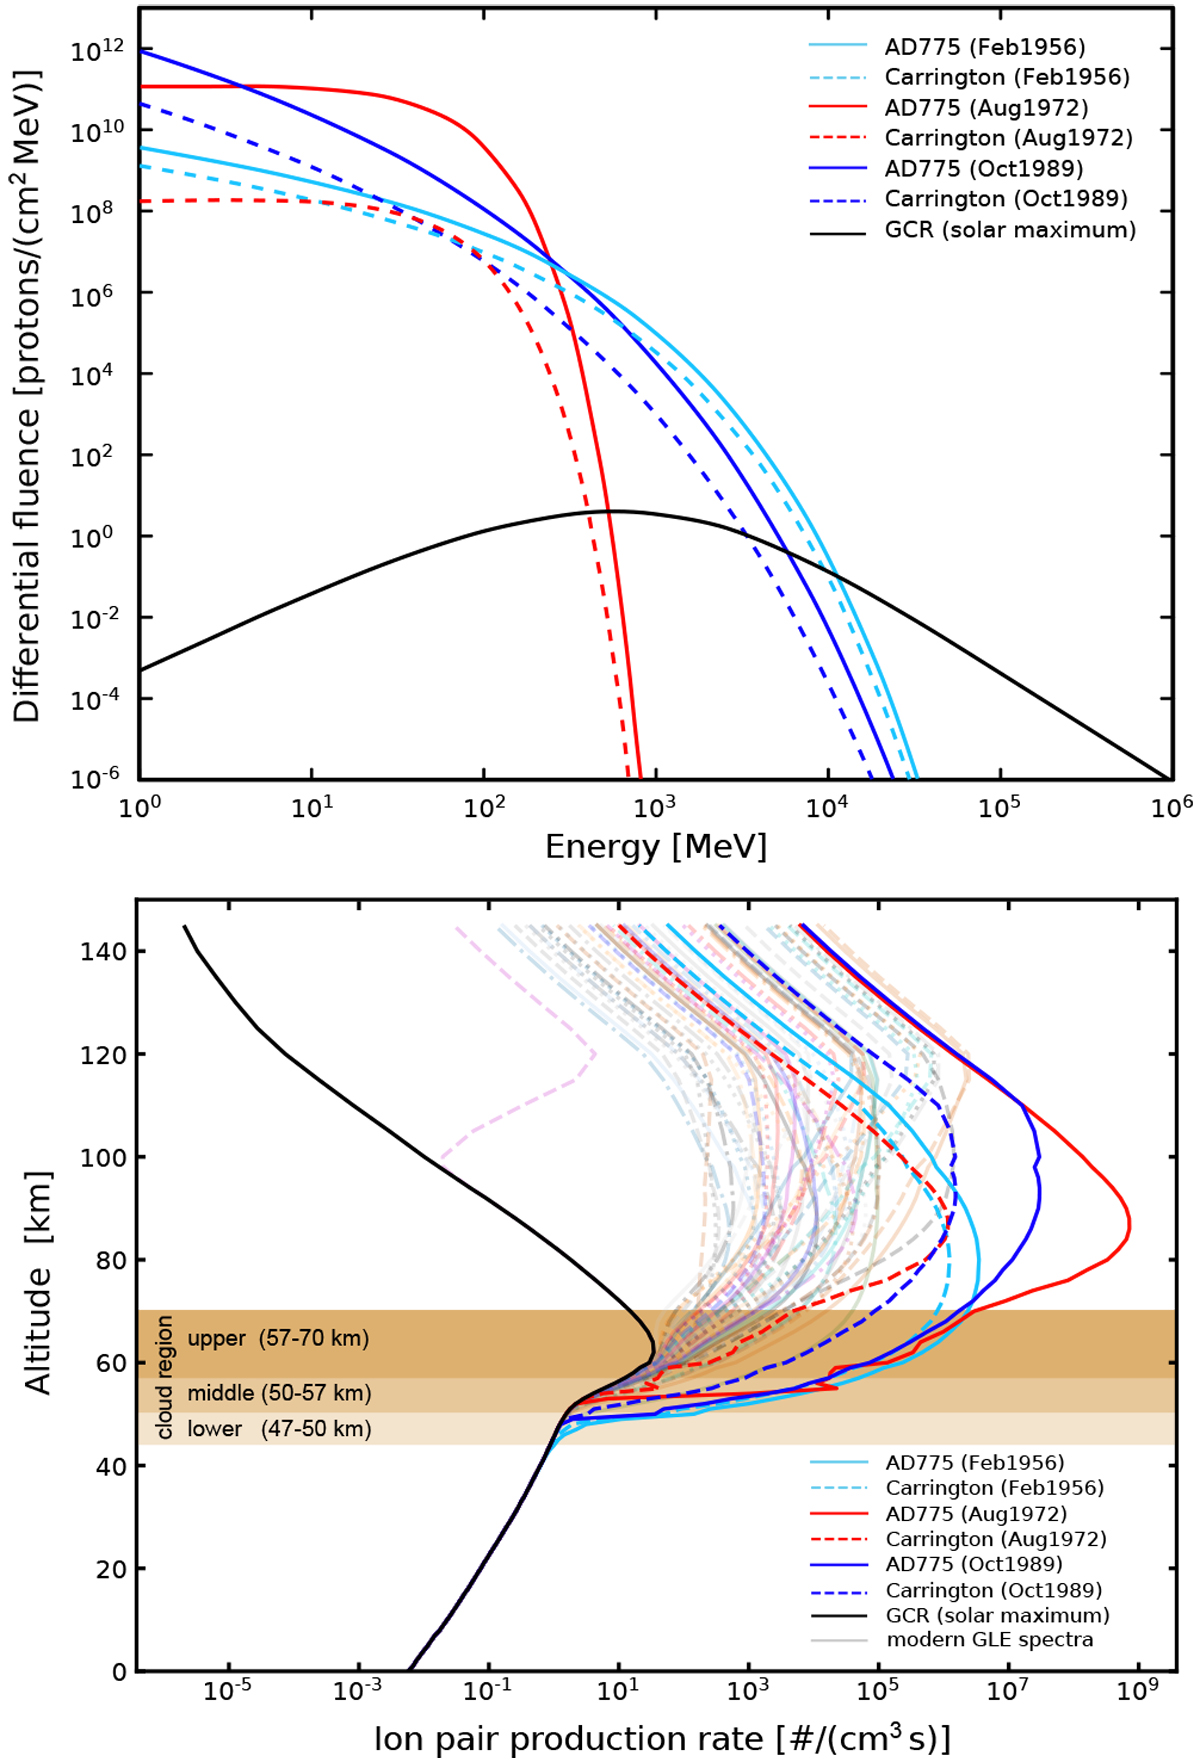
Upper panel: differential fluence spectra of both historical extreme SEP events, the Carrington event (dashed lines) as well as the AD775 event (solid lines) based on the shape of three different modern SEP events: February 1956 (in light blue), August 1972 (in red), and October 1989 (in blue). In order to account for a differential flux spectrum the results have been scaled to an event duration of 20 h (see Dartnell et al. 2015, for further information). Lower panel: event-induced ion-pair production rates depending on the above-mentioned spectra. For comparison the production rate values of the 71 modern SEP events (see Fig. 6) are displayed as shaded curves.
Current usage metrics show cumulative count of Article Views (full-text article views including HTML views, PDF and ePub downloads, according to the available data) and Abstracts Views on Vision4Press platform.
Data correspond to usage on the plateform after 2015. The current usage metrics is available 48-96 hours after online publication and is updated daily on week days.
Initial download of the metrics may take a while.