Fig. 6
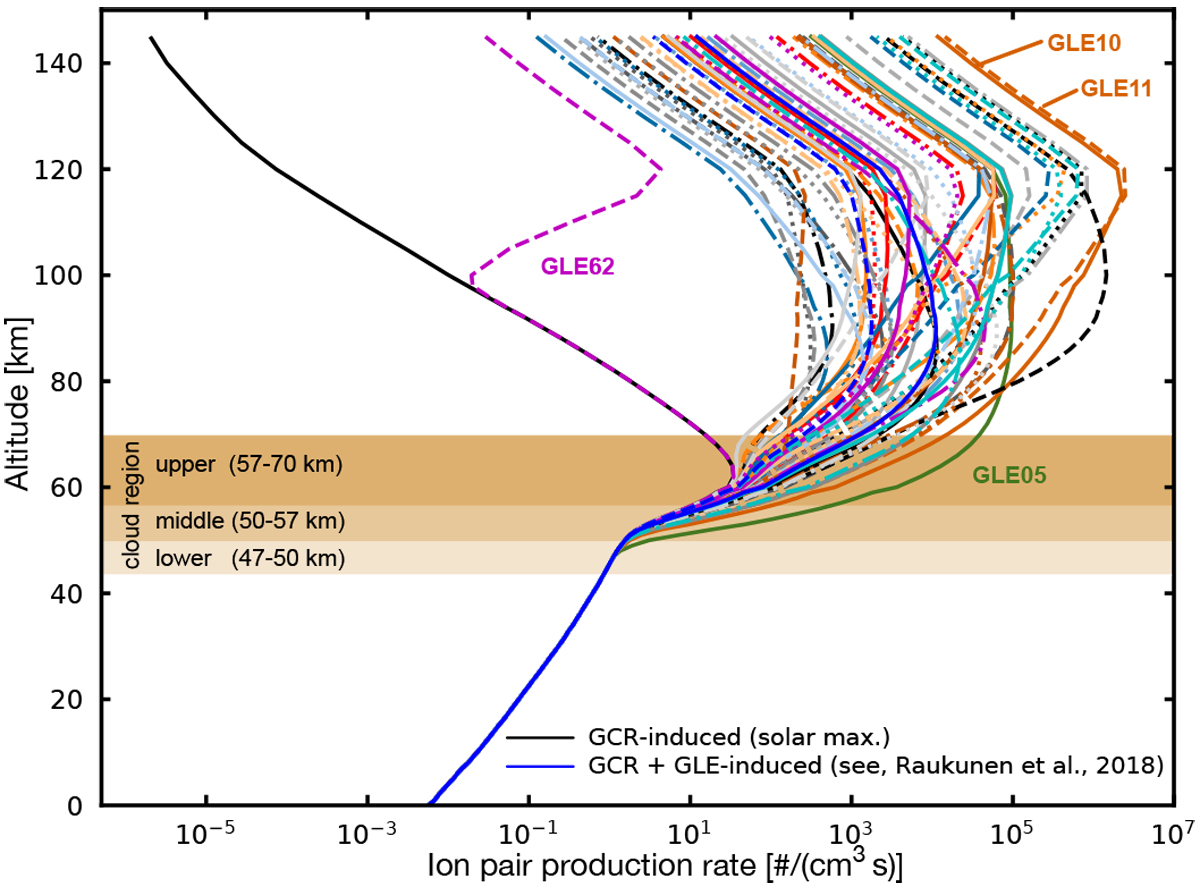
Influence of modern ordinary strong SEP spectra on the Venusian ion-pair production rate values. Shown is the sum of the GCR- induced background ionization (taking into account protons up to 10 TeV) during solar maximum conditions and the SEP-induced production rates (colored lines). Of particular interest in this study are the four labeled events: GLE05 (green line), GLE10 (orange solid line), GLE11 (orange dashed line), and GLE62 (purple line).
Current usage metrics show cumulative count of Article Views (full-text article views including HTML views, PDF and ePub downloads, according to the available data) and Abstracts Views on Vision4Press platform.
Data correspond to usage on the plateform after 2015. The current usage metrics is available 48-96 hours after online publication and is updated daily on week days.
Initial download of the metrics may take a while.