Fig. 5
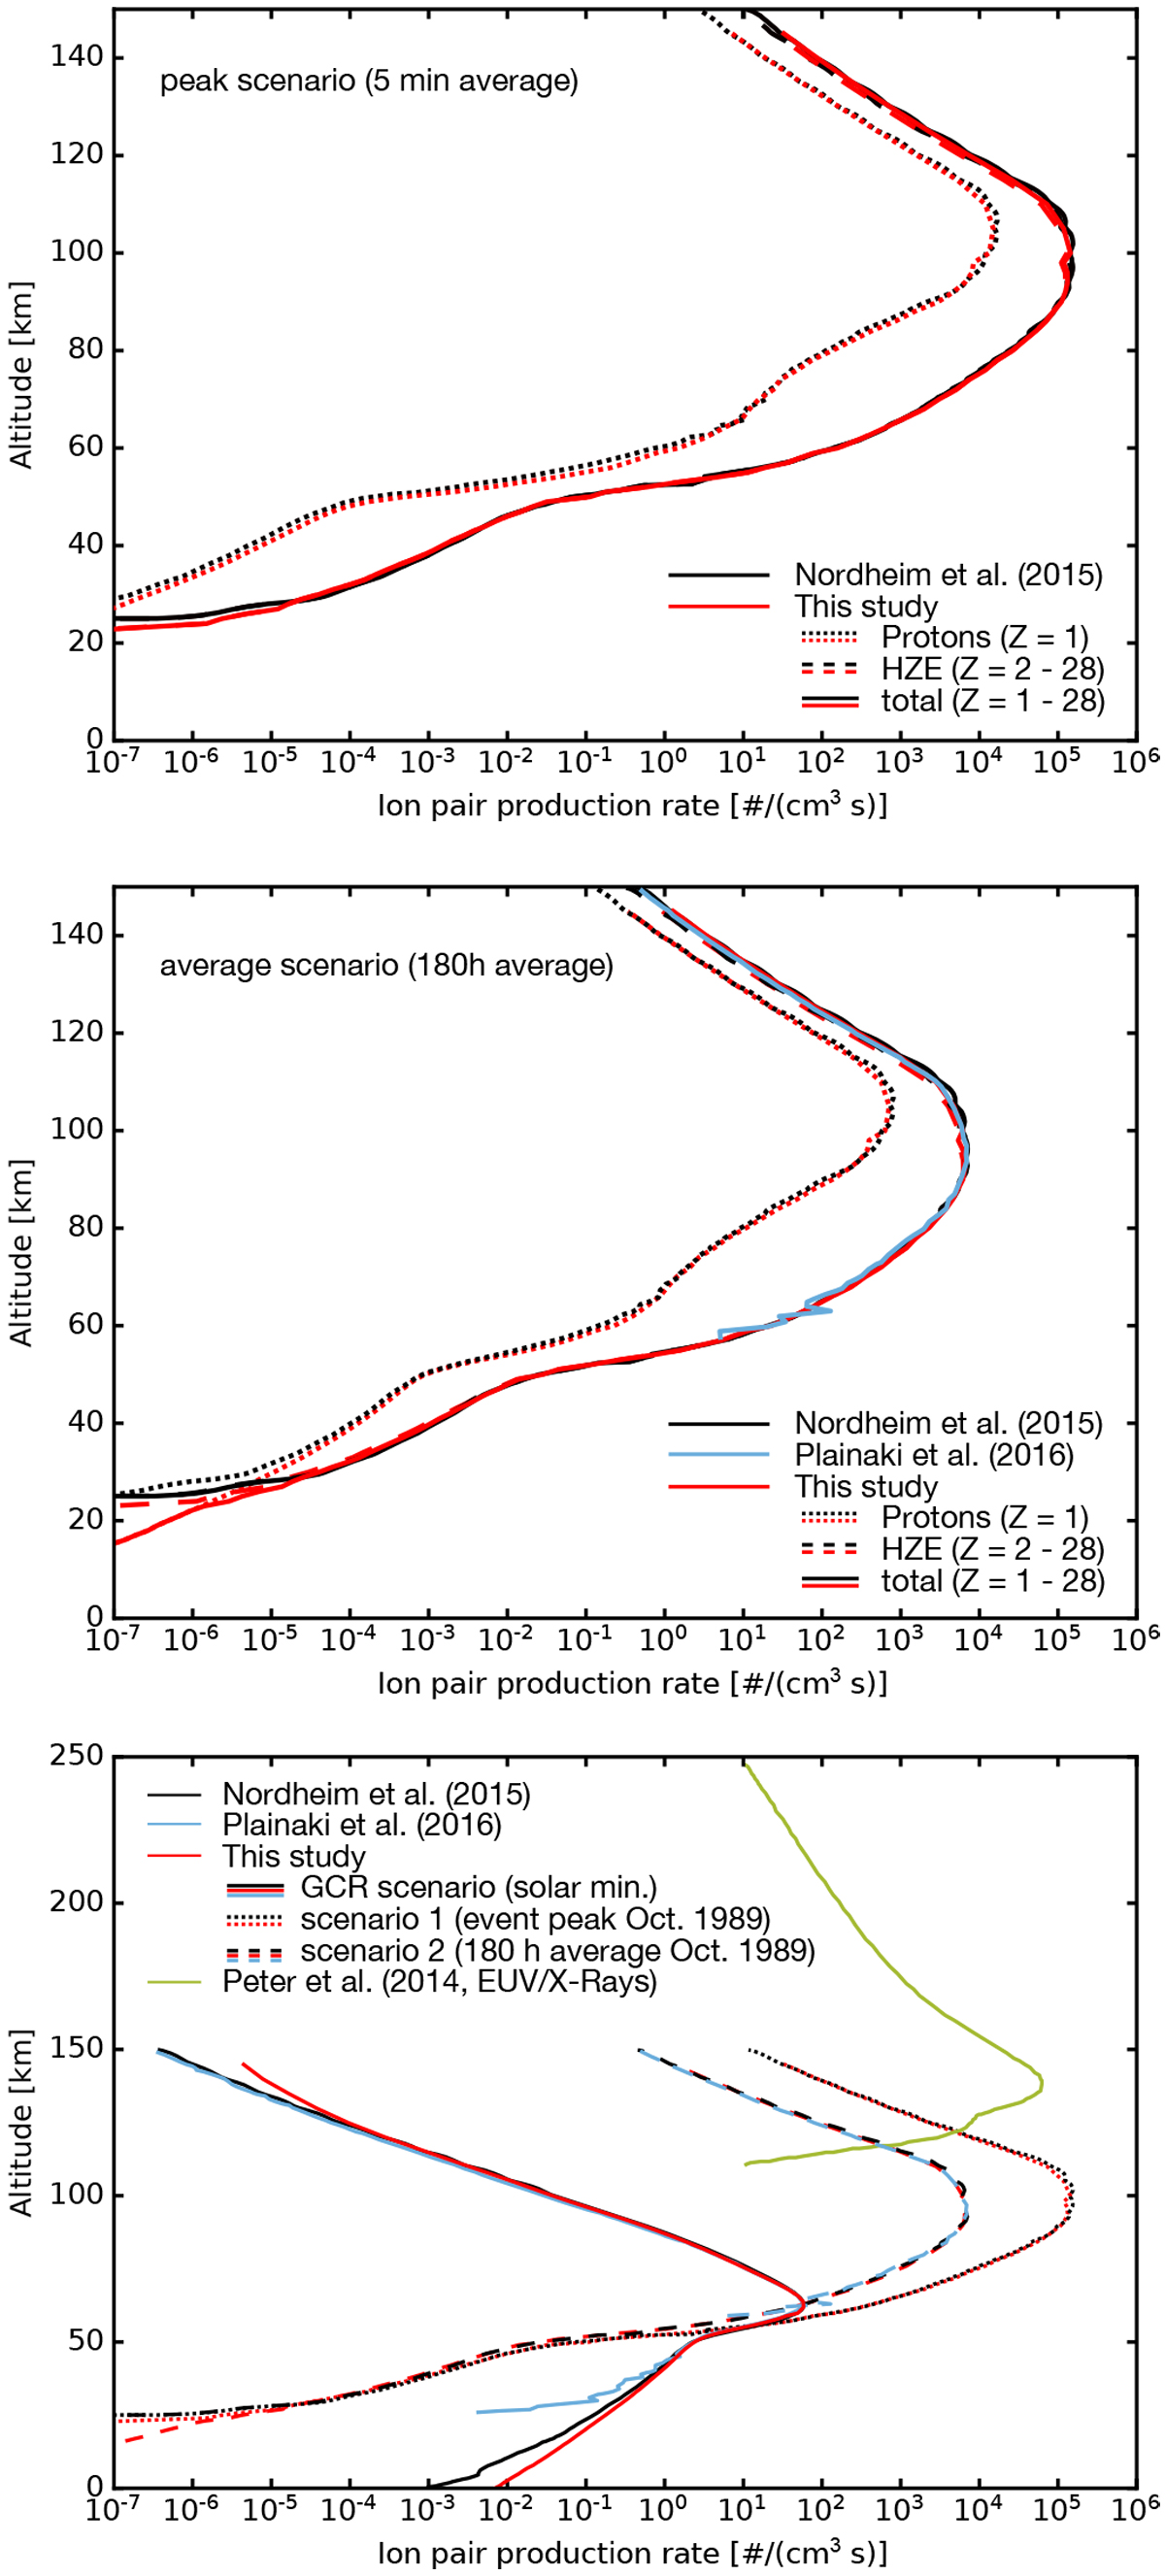
Upper panel: altitude-dependent ion pair production rates for the 5 min average event peak flux measured with the GOES spacecraft on October 20, 1989 (scenario 1). A comparison to the results by Nordheim et al. (2015, black curve) is given. Middle panel: altitude-dependent ion pair production rates induced by the particle fluxes averaged over 180 h starting at 1300 UTC on October 19, 1989 (scenario 2). Here in addition to the results by Nordheim et al. (2015, in black) the results by Plainaki et al. (2016) are displayd as blue line. Lower panel: comparison of the GCR- and strong SEP event-induced Venusian ionization. In addition the upper altitude-ionization due to EUV and X-rays on the Venusian day-side is shown (green line; Peter et al. 2014).
Current usage metrics show cumulative count of Article Views (full-text article views including HTML views, PDF and ePub downloads, according to the available data) and Abstracts Views on Vision4Press platform.
Data correspond to usage on the plateform after 2015. The current usage metrics is available 48-96 hours after online publication and is updated daily on week days.
Initial download of the metrics may take a while.