Fig. 3
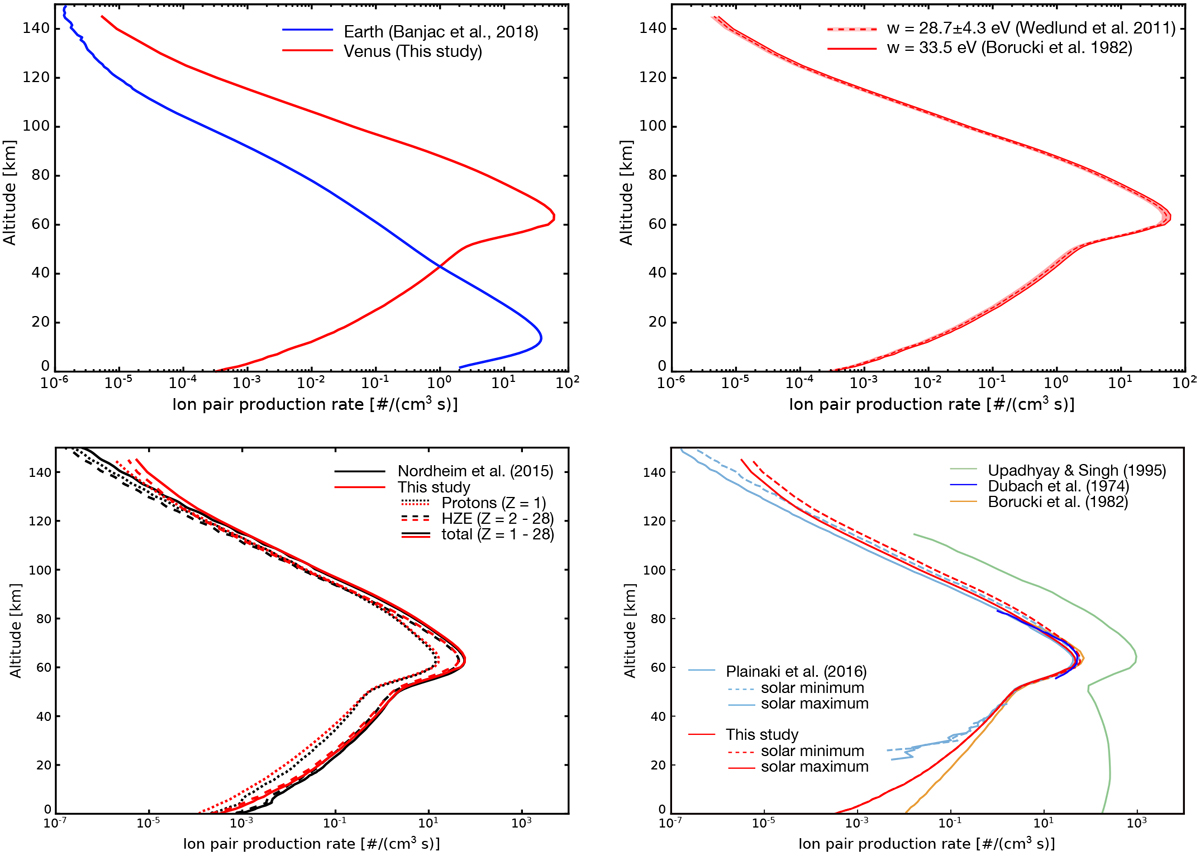
Upper left panel: altitude-dependent total ion pair production rates during solar minimum conditions at Venus (thisstudy, red solid line) and at Earth (blue line, see Banjac et al. 2019) as a reference. The following panels only address the Venusian ionization. Upper right panel: influence of the applied ionization potential w. Shown here are the model results for the w-values by Borucki et al. (1982, w = 33.5 eV, red solid line) and Simon Wedlund et al. (2011, w = 28.7 ± 4.3 eV, red dashed line and corresponding error band). Lower left panel: contribution of Z = 1 (protons, dashed lines) and Z = 2–28 (dotted lines) particles to the total atmospheric ionization (solid line) during solar minimum conditions. The results by Nordheim et al. (2015, black curves) are compared to the results of this study (red curves). Lower right panel: comparison of the altitude-dependent ionization rates by Plainaki et al. (2016, light blue curves) and the results of our study during solar minimum (solid lines) and solar maximum (dashed lines) conditions. In addition the results by Dubach et al. (1974; blue), Borucki et al. (1982, orange), and Upadhyay & Singh (1995; purple) are displayed.
Current usage metrics show cumulative count of Article Views (full-text article views including HTML views, PDF and ePub downloads, according to the available data) and Abstracts Views on Vision4Press platform.
Data correspond to usage on the plateform after 2015. The current usage metrics is available 48-96 hours after online publication and is updated daily on week days.
Initial download of the metrics may take a while.