Fig. 7.
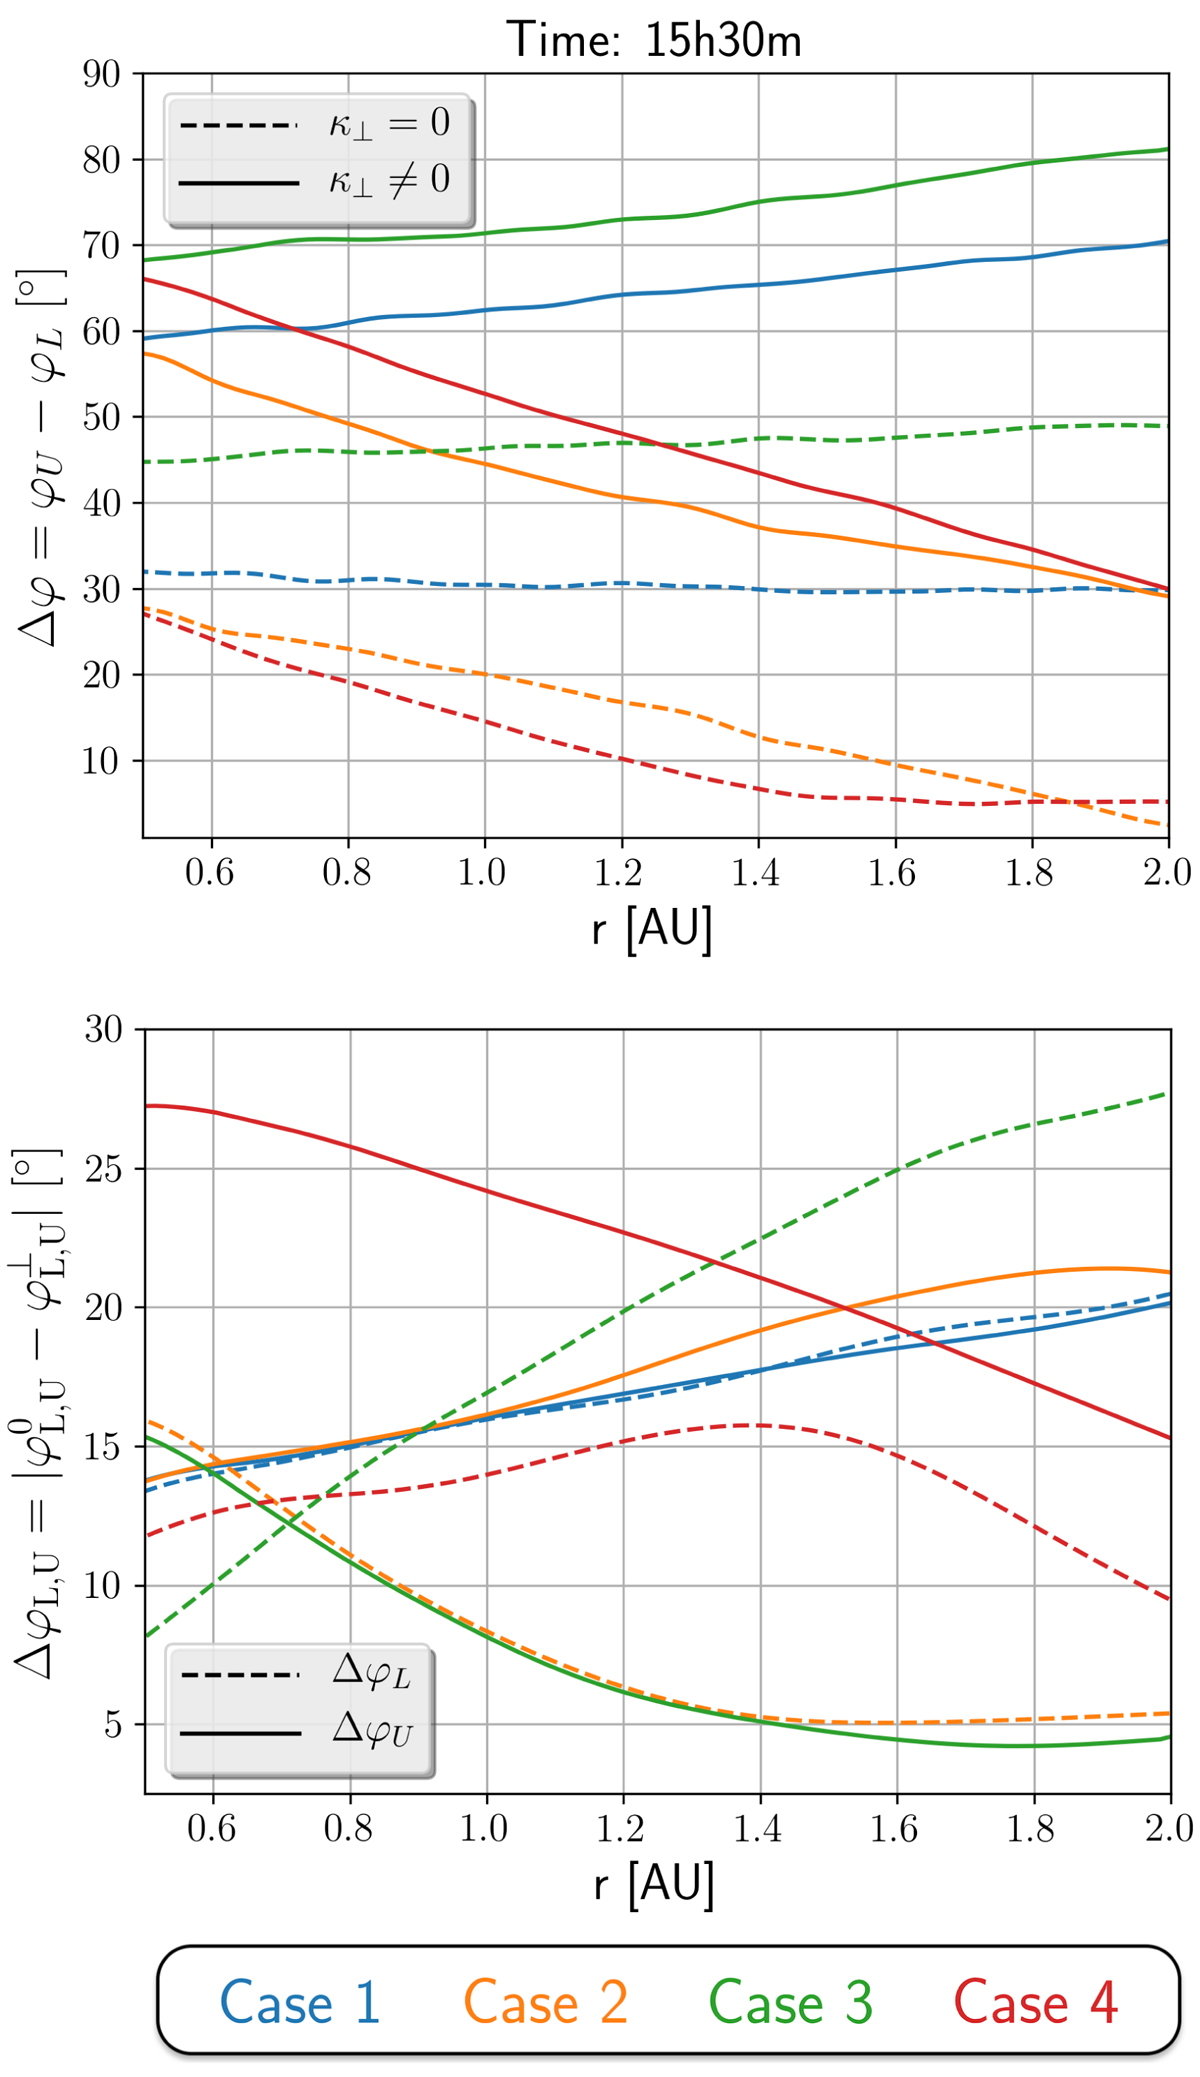
Upper panel: longitudinal width of the particle streaming zone for the simulations without (dashed lines) and with (solid lines) cross-field diffusion, 15.5 h after particle injection. Blue corresponds to case 1, orange to case 2, green to case 3, and red to case 4. Lower panel: longitudinal increase of the particle streaming zone at the lower (dashed) and upper (solid) longitude boundaries, 15.5 h after particle injection. The colour code follows the upper panel.
Current usage metrics show cumulative count of Article Views (full-text article views including HTML views, PDF and ePub downloads, according to the available data) and Abstracts Views on Vision4Press platform.
Data correspond to usage on the plateform after 2015. The current usage metrics is available 48-96 hours after online publication and is updated daily on week days.
Initial download of the metrics may take a while.