Fig. 2.
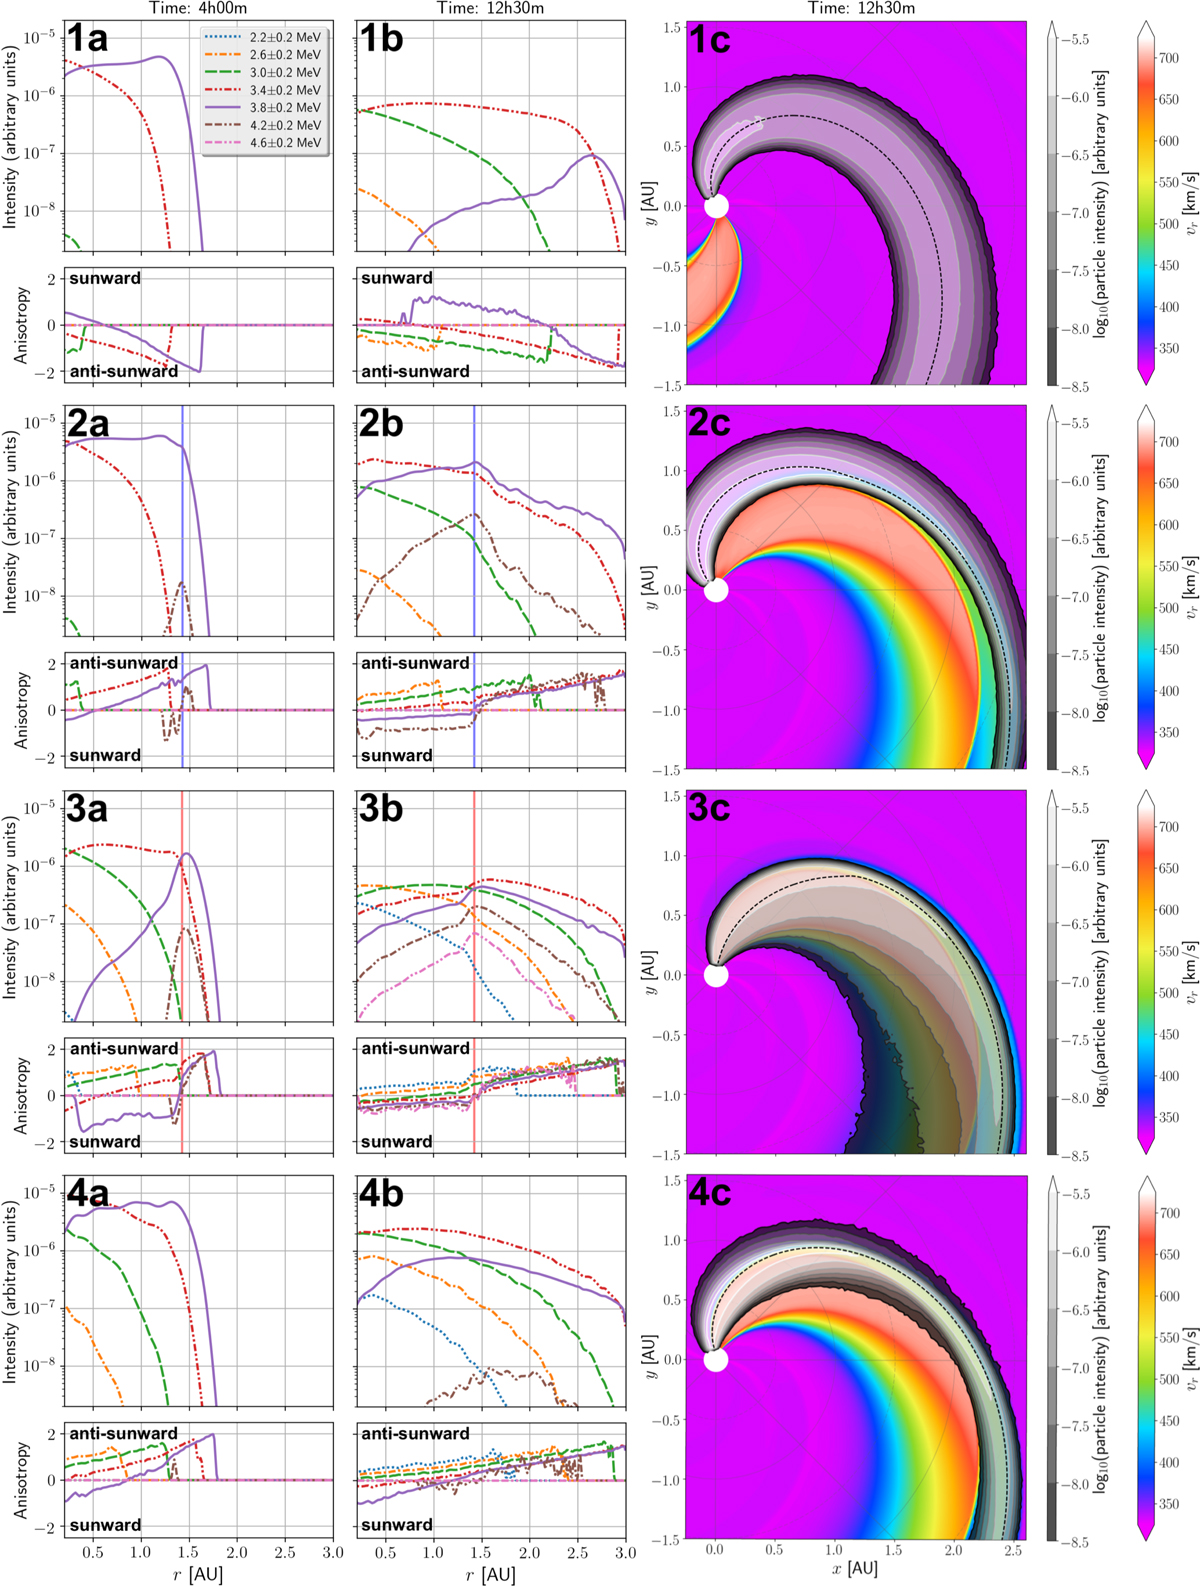
Columns a and b: snapshots of the particle intensities and anisotropies along a selected magnetic field line (see text). This IMF line is indicated by a dashed line in the figures of the column c. Column c: integrated particle intensities drawn in grey shades on top of the radial velocity profile of the solar wind. Each row shows the results for each injection region labelled by their number (see Fig. 1). The blue and red vertical lines indicate the forward and reverse shocks, respectively.
Current usage metrics show cumulative count of Article Views (full-text article views including HTML views, PDF and ePub downloads, according to the available data) and Abstracts Views on Vision4Press platform.
Data correspond to usage on the plateform after 2015. The current usage metrics is available 48-96 hours after online publication and is updated daily on week days.
Initial download of the metrics may take a while.