Free Access
Fig. B.1.
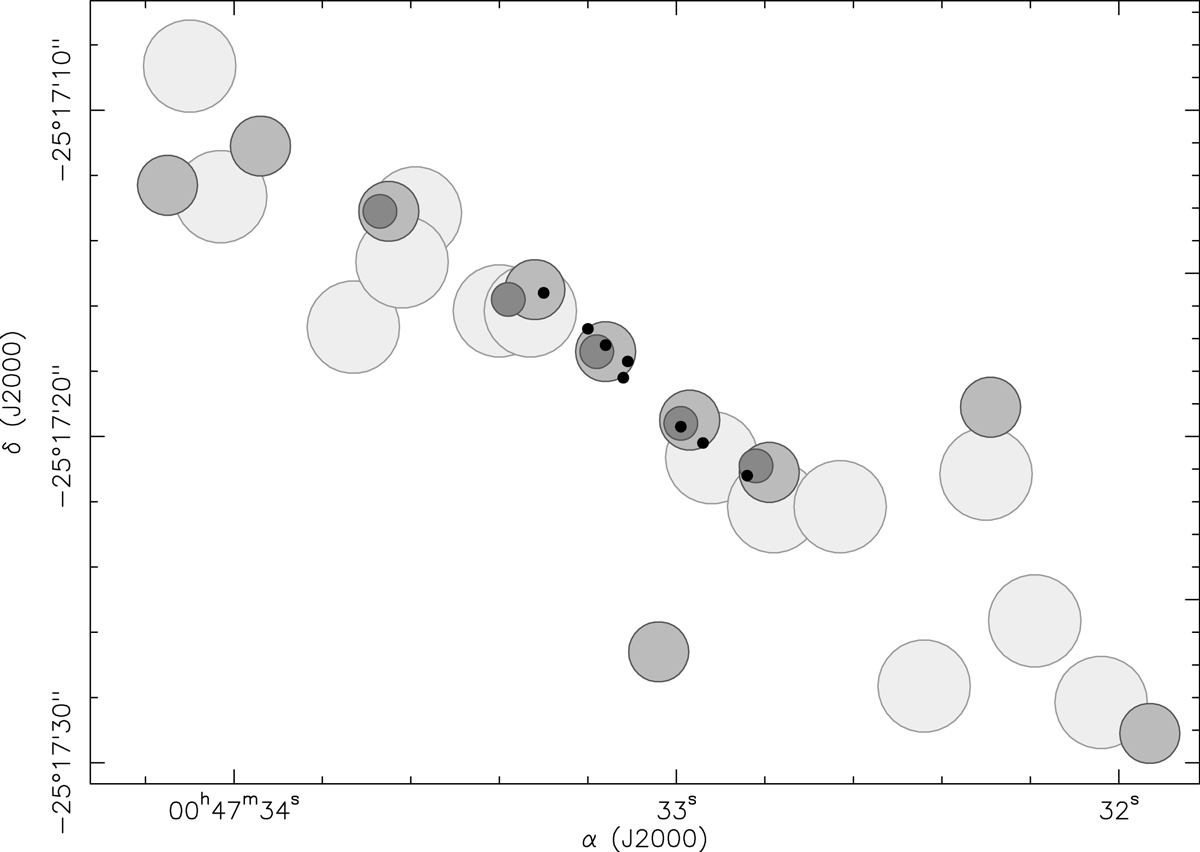
Location of the positions analysed in this paper (3″, light grey circles), compared to the positions from Meier et al. (2015; 2″, grey circles), Sakamoto et al. (2011; 1.1″, dark grey circles), and Ando et al. (2017; ∼0.37″, black dots). The size of the circles represent the resolution of the observations in these studies.
Current usage metrics show cumulative count of Article Views (full-text article views including HTML views, PDF and ePub downloads, according to the available data) and Abstracts Views on Vision4Press platform.
Data correspond to usage on the plateform after 2015. The current usage metrics is available 48-96 hours after online publication and is updated daily on week days.
Initial download of the metrics may take a while.