Free Access
Fig. 5.
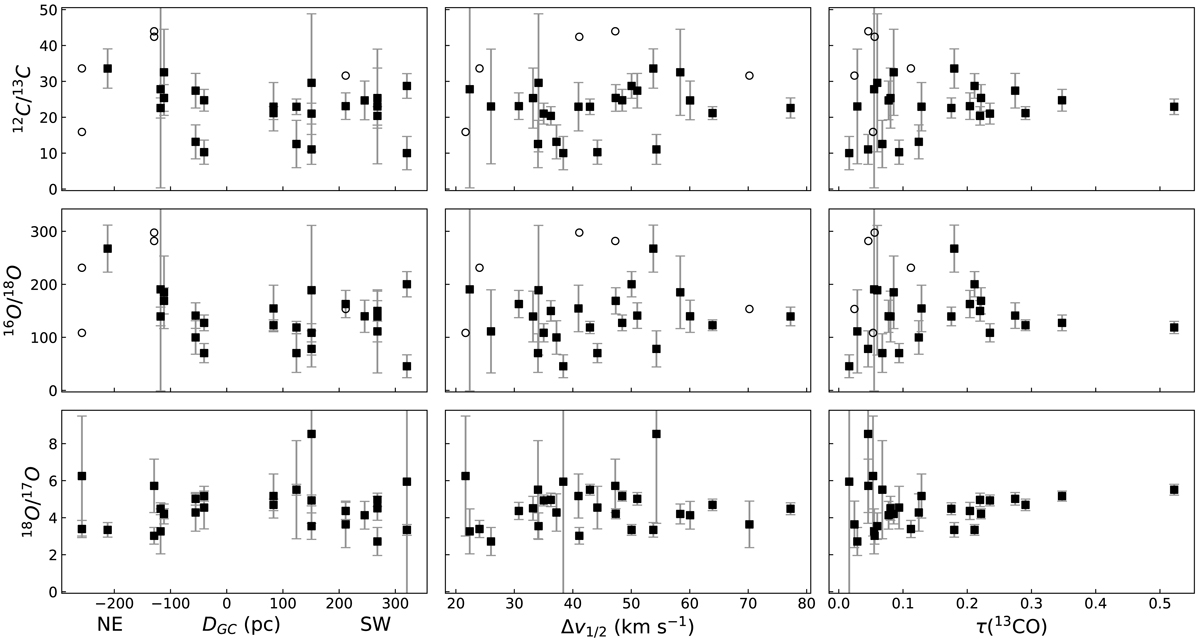
Measured isotopic ratios as a function of galactocentric distance, FWHM of the fitted profile, and optical depth of the 13CO transition. Ratios are calculated based on the column density ratios in Table 2. Lower limits (3σ) to the ratios due to non-detection of 13C18O are represented as open circles.
Current usage metrics show cumulative count of Article Views (full-text article views including HTML views, PDF and ePub downloads, according to the available data) and Abstracts Views on Vision4Press platform.
Data correspond to usage on the plateform after 2015. The current usage metrics is available 48-96 hours after online publication and is updated daily on week days.
Initial download of the metrics may take a while.