Fig. 4.
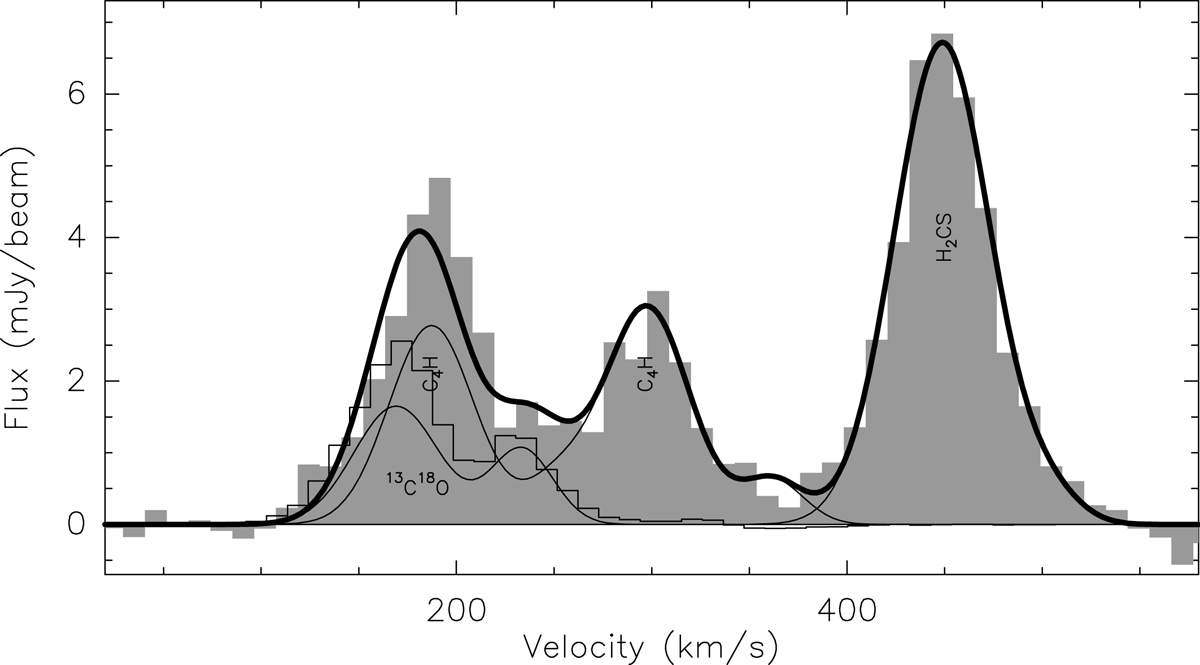
Spectra extracted at position 6 in Table 2. The grey filled histogram shows the spectrum around the 13C18O transition and the velocity scale refers to its rest frequency. The thick curve shows the overall fitted profile to the observations, while the thinner curves show the profiles of 13C18O, as well as the identified emission of the hyperfine structure of C4H (see Sect. 3.2.1 for details) and the line of H2CS. The empty histogram shows the 13CO profile (divided by 100) at the same position as a reference.
Current usage metrics show cumulative count of Article Views (full-text article views including HTML views, PDF and ePub downloads, according to the available data) and Abstracts Views on Vision4Press platform.
Data correspond to usage on the plateform after 2015. The current usage metrics is available 48-96 hours after online publication and is updated daily on week days.
Initial download of the metrics may take a while.