Fig. 2.
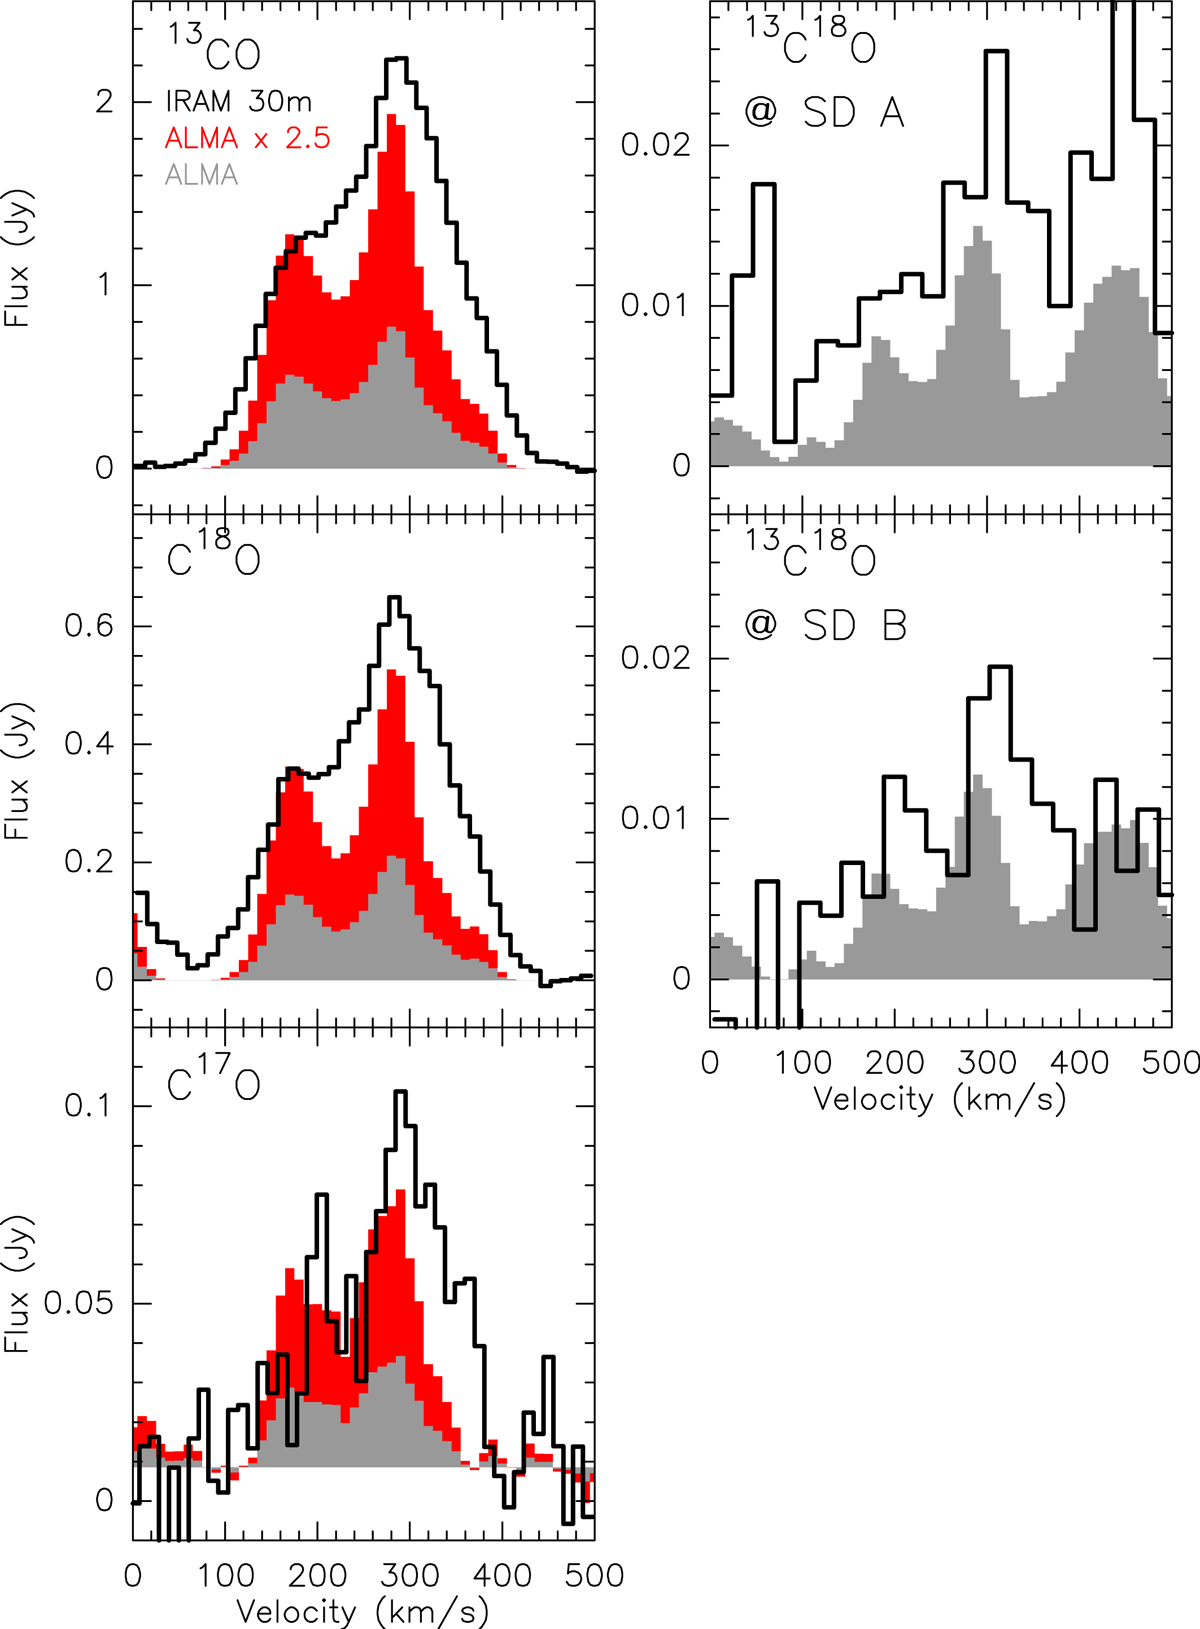
Spectra measured with the IRAM 30 m telescope (Aladro et al. 2015) and the ALMA observations presented in this work. ALMA spectra were extracted at the same positions as the single-dish observations from the data cubes smoothed to 23″ resolution. For 13CO, C18O, and C17O, the ALMA data are shown both with their actual flux (grey histogram) and multiplied by 2.5 (red histogram) for comparison with the single dish line profiles (black line). For 13C18O, we show the profiles in both SD A and SD B positions in Fig. 1, for comparison with the single dish data from Aladro et al. (2015) and Martín et al. (2010), respectively. See text in Sect. 3.1.1 for details.
Current usage metrics show cumulative count of Article Views (full-text article views including HTML views, PDF and ePub downloads, according to the available data) and Abstracts Views on Vision4Press platform.
Data correspond to usage on the plateform after 2015. The current usage metrics is available 48-96 hours after online publication and is updated daily on week days.
Initial download of the metrics may take a while.