Fig. 1.
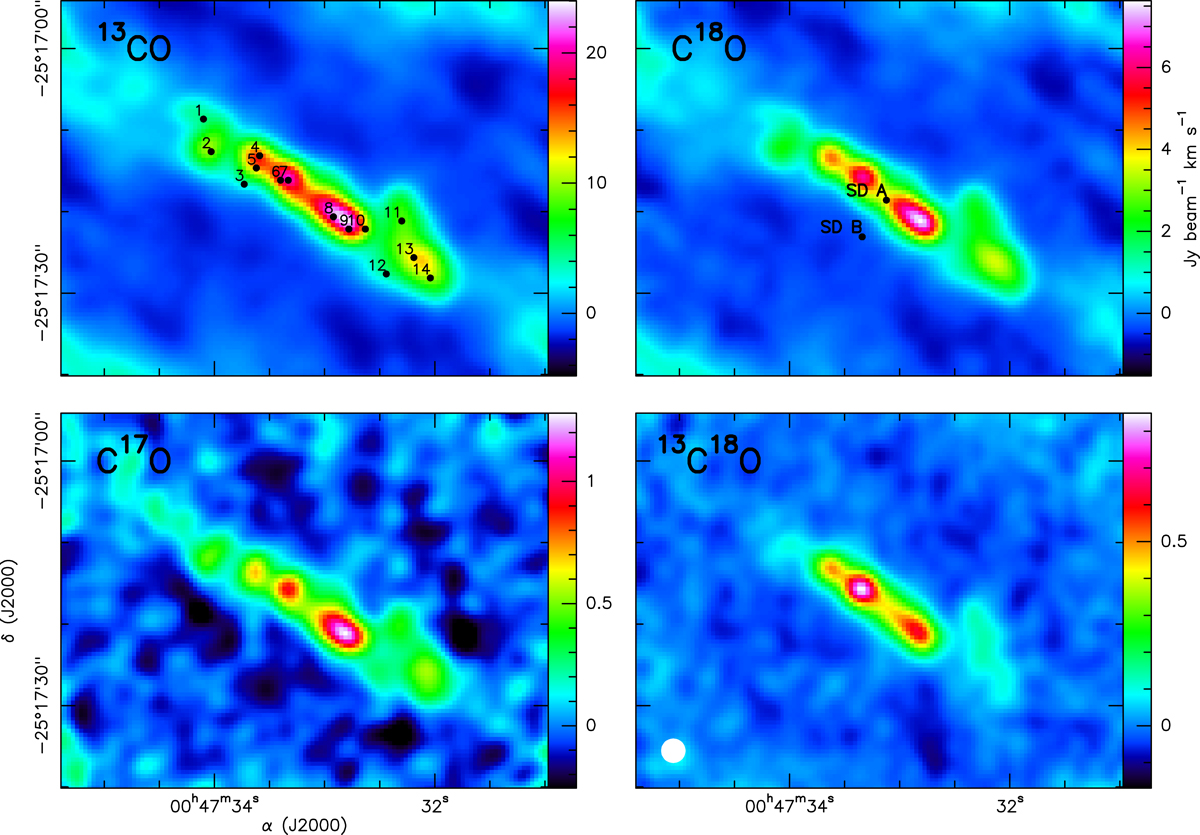
Integrated intensity images of the J = 1−0 transitions of all the CO isotopologues targeted in this work. Line emission is integrated in the velocity range 50−450 km s−1. The common beam size of 3″ (∼50 pc) is shown as a white circle in the bottom left corner of the 13C18O map. The emission of 13C18O is contaminated at the higher velocities in some positions as discussed in Sect. 3.2.1 and shown in Fig. 4. This contamination results in the brighter 13C18O region at position 7 differing from the brightest spot from the other isotopologues approximately at position 9. Marked positions numbered 1 to 14 indicate those selected for spectra extraction and analysis (Sect. 3.2). Nominal positions of the single dish spectra from the literature used for comparison are labelled SD A and B (Sect. 3.1.1).
Current usage metrics show cumulative count of Article Views (full-text article views including HTML views, PDF and ePub downloads, according to the available data) and Abstracts Views on Vision4Press platform.
Data correspond to usage on the plateform after 2015. The current usage metrics is available 48-96 hours after online publication and is updated daily on week days.
Initial download of the metrics may take a while.